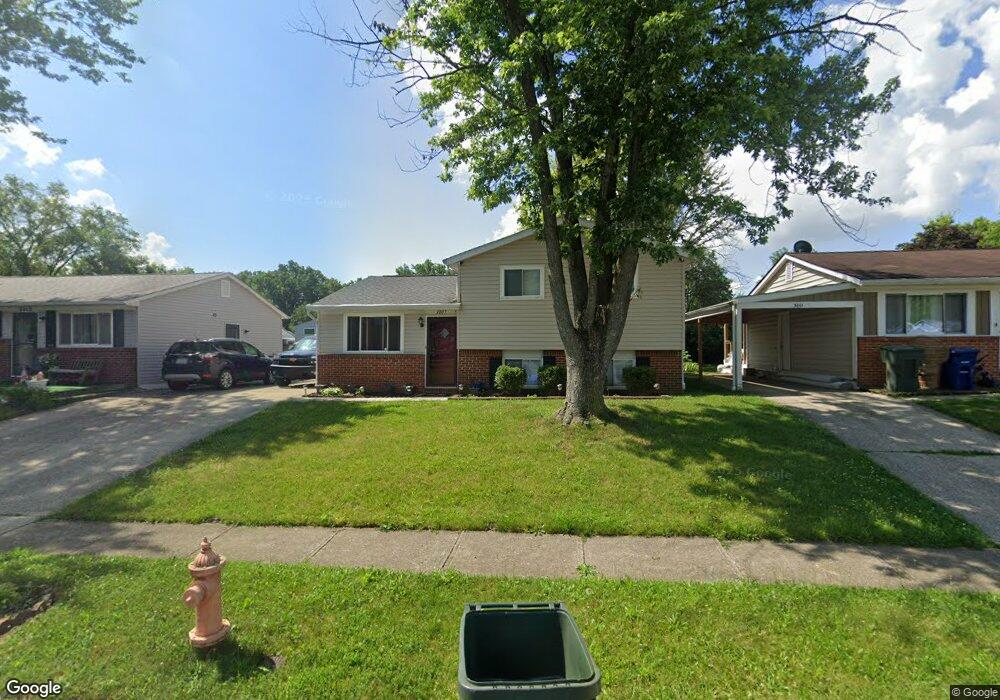
3007 Glenshaw Ave Columbus, OH 43231
Parkview NeighborhoodEstimated Value: $243,000 - $283,000
3
Beds
2
Baths
1,426
Sq Ft
$190/Sq Ft
Est. Value
About This Home
This home is located at 3007 Glenshaw Ave, Columbus, OH 43231 and is currently estimated at $270,282, approximately $189 per square foot. 3007 Glenshaw Ave is a home located in Franklin County with nearby schools including Hawthorne Elementary School, Heritage Middle School, and Westerville South High School.
Ownership History
Date
Name
Owned For
Owner Type
Purchase Details
Closed on
Sep 12, 2007
Sold by
Residential Opportunities Ltd
Bought by
Moreta Leticia
Current Estimated Value
Home Financials for this Owner
Home Financials are based on the most recent Mortgage that was taken out on this home.
Original Mortgage
$113,124
Outstanding Balance
$71,365
Interest Rate
6.5%
Mortgage Type
FHA
Estimated Equity
$198,917
Purchase Details
Closed on
Oct 31, 2006
Sold by
Strohl George F and Strohl Catherine Gill
Bought by
Residential Opportunities Ltd
Purchase Details
Closed on
Aug 26, 2005
Sold by
Stinehelfer Terry L
Bought by
Strohl George F and Strohl Catherine Gill
Purchase Details
Closed on
Feb 28, 1974
Bought by
Stinehelfer Terry L
Create a Home Valuation Report for This Property
The Home Valuation Report is an in-depth analysis detailing your home's value as well as a comparison with similar homes in the area
Home Values in the Area
Average Home Value in this Area
Purchase History
| Date | Buyer | Sale Price | Title Company |
|---|---|---|---|
| Moreta Leticia | $114,900 | Attorney | |
| Residential Opportunities Ltd | -- | None Available | |
| Strohl George F | $110,000 | Talon Group | |
| Stinehelfer Terry L | -- | -- |
Source: Public Records
Mortgage History
| Date | Status | Borrower | Loan Amount |
|---|---|---|---|
| Open | Moreta Leticia | $113,124 |
Source: Public Records
Tax History Compared to Growth
Tax History
| Year | Tax Paid | Tax Assessment Tax Assessment Total Assessment is a certain percentage of the fair market value that is determined by local assessors to be the total taxable value of land and additions on the property. | Land | Improvement |
|---|---|---|---|---|
| 2024 | $3,818 | $74,800 | $20,510 | $54,290 |
| 2023 | $3,728 | $74,795 | $20,510 | $54,285 |
| 2022 | $3,042 | $46,590 | $9,030 | $37,560 |
| 2021 | $3,071 | $46,590 | $9,030 | $37,560 |
| 2020 | $3,061 | $46,590 | $9,030 | $37,560 |
| 2019 | $2,680 | $38,820 | $7,530 | $31,290 |
| 2018 | $2,549 | $38,820 | $7,530 | $31,290 |
| 2017 | $2,630 | $38,820 | $7,530 | $31,290 |
| 2016 | $2,469 | $33,250 | $7,910 | $25,340 |
| 2015 | $2,475 | $33,250 | $7,910 | $25,340 |
| 2014 | $2,477 | $33,250 | $7,910 | $25,340 |
| 2013 | $1,299 | $35,000 | $8,330 | $26,670 |
Source: Public Records
Map
Nearby Homes
- 3010 Bennington Ave
- 3098 Bennington Ave
- 3201 Pelden Ct
- 4279 Morsetown Ct
- 4266 Morsetown Ct
- 2691 Northwold Rd
- 0 Ashbury Rd
- 4216 Grayfriars Ln
- 2625 Clybourne Rd
- 4169 Commander Ln
- 2618 Clybourne Rd
- 0 Abington Rd Unit 224031739
- 0 Abington Rd Unit 224031704
- 0 Abington Rd Unit 224031738
- 0 Abington Rd Unit 224031699
- 2903 Kilbourne Ave
- 3378 Trail Lane Ct
- 4161 Grayfriars Ln
- 0 Chester Rd
- 2594 Adda Ave
- 3013 Glenshaw Ave
- 3001 Glenshaw Ave
- 3019 Glenshaw Ave
- 2993 Glenshaw Ave
- 3004 Bennington Ave
- 2998 Bennington Ave
- 3018 Bennington Ave
- 3025 Glenshaw Ave
- 2987 Glenshaw Ave
- 4454 Cheswick Rd
- 3024 Bennington Ave
- 4465 Cheswick Rd
- 3033 Glenshaw Ave
- 2984 Bennington Ave
- 2981 Glenshaw Ave
- 3030 Bennington Ave
- 2990 Glenshaw Ave
- 4460 Cheswick Rd
- 2978 Bennington Ave