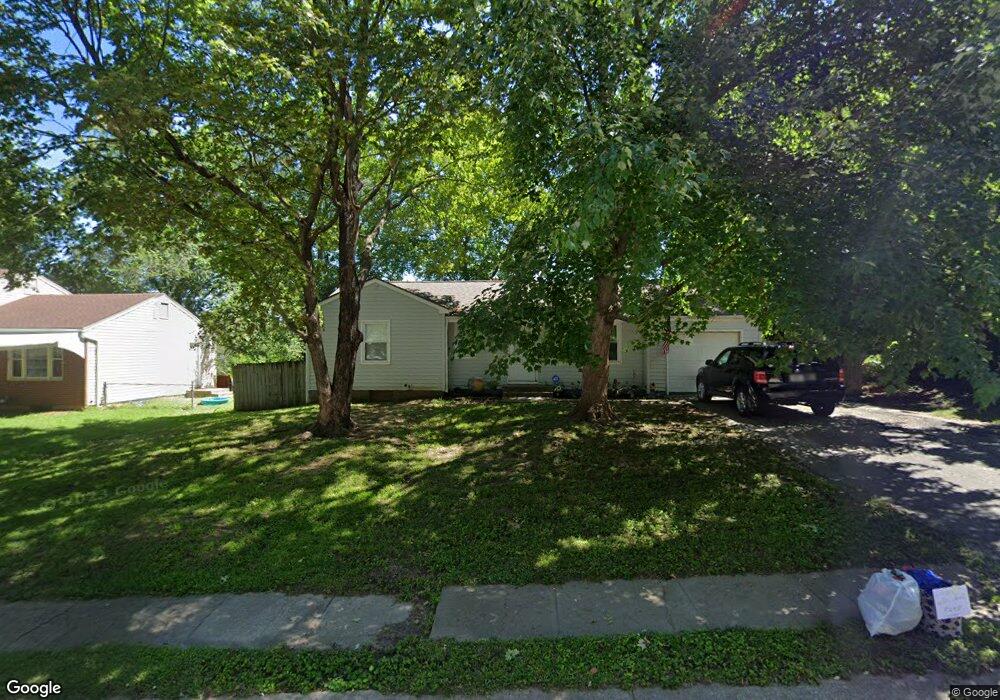
3007 N Osage St Independence, MO 64050
Kentucky Hills NeighborhoodEstimated Value: $97,000 - $192,000
3
Beds
2
Baths
1,130
Sq Ft
$141/Sq Ft
Est. Value
About This Home
This home is located at 3007 N Osage St, Independence, MO 64050 and is currently estimated at $158,902, approximately $140 per square foot. 3007 N Osage St is a home located in Jackson County with nearby schools including Mill Creek Elementary School, Bridger Middle School, and Bingham Middle School.
Ownership History
Date
Name
Owned For
Owner Type
Purchase Details
Closed on
Dec 27, 2023
Sold by
Frazee Daniel W
Bought by
Decalog Llc 7 Series
Current Estimated Value
Purchase Details
Closed on
Apr 14, 2010
Sold by
Secretary Of Housing & Urban Development
Bought by
Frazee Daniel W
Purchase Details
Closed on
Nov 4, 2009
Sold by
Davis Brian A and Hunner Davis Angela R
Bought by
Secretary Of Housing & Urban Development
Purchase Details
Closed on
Apr 8, 1998
Sold by
Principal Residential Mtg Inc
Bought by
Hud
Purchase Details
Closed on
Mar 26, 1998
Sold by
Hoffman Douglas S and Hoffman Tisha A
Bought by
Principal Residential Mtg Inc
Purchase Details
Closed on
Mar 13, 1997
Sold by
Randall Tina and Long Tina
Bought by
Hoffman Douglas S
Home Financials for this Owner
Home Financials are based on the most recent Mortgage that was taken out on this home.
Original Mortgage
$56,200
Interest Rate
7.89%
Mortgage Type
FHA
Create a Home Valuation Report for This Property
The Home Valuation Report is an in-depth analysis detailing your home's value as well as a comparison with similar homes in the area
Home Values in the Area
Average Home Value in this Area
Purchase History
| Date | Buyer | Sale Price | Title Company |
|---|---|---|---|
| Decalog Llc 7 Series | -- | None Listed On Document | |
| Frazee Daniel W | -- | None Available | |
| Secretary Of Housing & Urban Development | $77,714 | None Available | |
| Hud | -- | -- | |
| Principal Residential Mtg Inc | $60,755 | -- | |
| Hoffman Douglas S | -- | Stewart Title |
Source: Public Records
Mortgage History
| Date | Status | Borrower | Loan Amount |
|---|---|---|---|
| Previous Owner | Hoffman Douglas S | $56,200 |
Source: Public Records
Tax History
| Year | Tax Paid | Tax Assessment Tax Assessment Total Assessment is a certain percentage of the fair market value that is determined by local assessors to be the total taxable value of land and additions on the property. | Land | Improvement |
|---|---|---|---|---|
| 2025 | $1,584 | $13,568 | $3,211 | $10,357 |
| 2024 | $1,548 | $22,861 | $1,904 | $20,957 |
| 2023 | $1,548 | $22,861 | $2,502 | $20,359 |
| 2022 | $758 | $10,260 | $2,736 | $7,524 |
| 2021 | $758 | $10,260 | $2,736 | $7,524 |
| 2020 | $745 | $9,800 | $2,736 | $7,064 |
| 2019 | $733 | $9,800 | $2,736 | $7,064 |
| 2018 | $730 | $9,314 | $999 | $8,315 |
| 2016 | $718 | $9,081 | $2,740 | $6,341 |
Source: Public Records
Map
Nearby Homes
- 303 W Marcia Ave
- 2402 N Liberty St
- 503 W Colonel Dr
- 3303 N Mccoy St
- 3302 N Delaware St
- 2806 N River Blvd
- 2910 N River Terrace
- 3801 N Osage St
- 13212 Kemper Ct
- 822 Dickinson Rd
- 14500 E Kentucky Rd
- 915 Dickinson Rd
- 1608 N Liberty St
- 1704 N Emery St
- 711 W Jones St
- 3015 Cement City Rd
- 0 N Allen Rd
- 805 N Allen Rd
- 1315 N Mccoy St
- 14815 E Mayes Rd
- 3005 N Osage St
- 3103 N Osage St
- 3003 N Osage St
- 301 W Marcia Ave
- 300 W Marcia Ave
- 3002 N Osage St
- 3001 N Osage St
- 3102 N Osage St
- 3105 N Osage St
- 2918 N Mccomas Ln
- 2404 N Liberty St
- 301 W Colonel Dr
- 302 W Marcia Ave
- 2909 N Osage St
- 305 W Marcia Ave
- 2916 N Mccomas Ln
- 304 W Marcia Ave
- 2400 N Liberty St
- 2907 N Osage St
- 303 W Colonel Dr
Your Personal Tour Guide
Ask me questions while you tour the home.