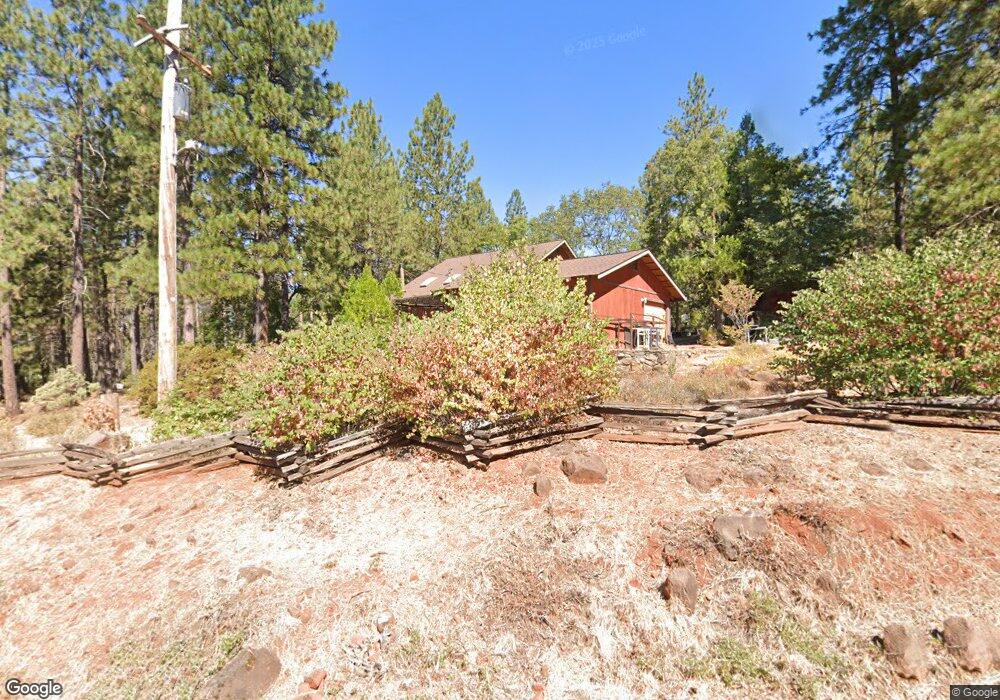
30072 Whitmore Rd Whitmore, CA 96096
Estimated Value: $353,228 - $552,000
3
Beds
2
Baths
1,700
Sq Ft
$245/Sq Ft
Est. Value
About This Home
This home is located at 30072 Whitmore Rd, Whitmore, CA 96096 and is currently estimated at $416,807, approximately $245 per square foot. 30072 Whitmore Rd is a home located in Shasta County with nearby schools including Whitmore Elementary School, Foothill High School, and New Day Academy - Shasta.
Ownership History
Date
Name
Owned For
Owner Type
Purchase Details
Closed on
May 19, 2022
Sold by
Evans Bonnie S
Bought by
Bonnie S Evans Revocable Trust
Current Estimated Value
Purchase Details
Closed on
Jun 22, 2004
Sold by
Tausch Chad T and Tausch Jennifer M
Bought by
Evans Brian C and Seidel Bonnie S
Home Financials for this Owner
Home Financials are based on the most recent Mortgage that was taken out on this home.
Original Mortgage
$188,000
Interest Rate
6.27%
Mortgage Type
Unknown
Purchase Details
Closed on
Apr 30, 2002
Sold by
Ramstad Dolores Darleen and Ramstad Dolores D
Bought by
Tausch Chad T and Tausch Jennifer M
Home Financials for this Owner
Home Financials are based on the most recent Mortgage that was taken out on this home.
Original Mortgage
$140,657
Interest Rate
7.18%
Create a Home Valuation Report for This Property
The Home Valuation Report is an in-depth analysis detailing your home's value as well as a comparison with similar homes in the area
Purchase History
| Date | Buyer | Sale Price | Title Company |
|---|---|---|---|
| Bonnie S Evans Revocable Trust | -- | Arel Justin G | |
| Evans Brian C | $235,000 | Fidelity Natl Title Co Of Ca | |
| Tausch Chad T | $176,000 | Fidelity National Title Co |
Source: Public Records
Mortgage History
| Date | Status | Borrower | Loan Amount |
|---|---|---|---|
| Previous Owner | Evans Brian C | $188,000 | |
| Previous Owner | Tausch Chad T | $140,657 | |
| Closed | Tausch Chad T | $17,532 |
Source: Public Records
Tax History
| Year | Tax Paid | Tax Assessment Tax Assessment Total Assessment is a certain percentage of the fair market value that is determined by local assessors to be the total taxable value of land and additions on the property. | Land | Improvement |
|---|---|---|---|---|
| 2025 | $3,362 | $334,100 | $71,078 | $263,022 |
| 2024 | $3,311 | $327,550 | $69,685 | $257,865 |
| 2023 | $3,311 | $321,128 | $68,319 | $252,809 |
| 2022 | $3,226 | $314,832 | $66,980 | $247,852 |
| 2021 | $2,809 | $275,000 | $60,000 | $215,000 |
| 2020 | $2,739 | $265,000 | $60,000 | $205,000 |
| 2019 | $2,720 | $265,000 | $60,000 | $205,000 |
| 2018 | $2,695 | $260,000 | $60,000 | $200,000 |
| 2017 | $2,611 | $250,000 | $60,000 | $190,000 |
| 2016 | $2,513 | $250,000 | $60,000 | $190,000 |
| 2015 | $2,432 | $242,000 | $60,000 | $182,000 |
| 2014 | $2,326 | $230,000 | $50,000 | $180,000 |
Source: Public Records
Map
Nearby Homes
- 11664 Mc Alester Trail
- 0000 Whitmore Rd
- 0 Hidden Springs Ln
- 11828 Atkins Rd
- 011 Whitmore Village Rd
- 10648 Honey Bear Ln
- 9568 Blue Mountain Ranch Rd
- 29140 S Cow Creek Rd
- 29140 S Cow Creeek
- 0 Faye Wildcat Ranch Rd
- 12757 Fern Rd
- 9341 Ponderosa Way
- 715 W Pine Dr
- 0 Ponderosa Way
- 13575 English Way
- 0 Oak Run To Fern Rd Unit 22907761
- 29960 Wengler Hill Rd
- 7673 Ponderosa Way
- 29866 California 44
- 7722 Hidden Creek Ln
- 15 acres Whitmore Rd
- 134 acres Whitmore Rd
- 5.02 Acres Whitmore Rd
- Lot 10 Whitmore Rd
- Lot 8 Whitmore Rd
- Lot 6 Whitmore Rd
- Lot 9 Whitmore Rd
- Lot 4 Whitmore Rd
- Lot 5 Whitmore Rd
- Lot 7 Whitmore Rd
- Lot 3 Whitmore Rd
- #25 Whitmore Rd
- 30139 Whitmore Rd
- 30162 Whitmore 1weup7ny0hdu
- 30162 Whitmore Rd
- 29985 Whitmore Rd
- 5 Ac Whitmore Rd
- 0 5 Acres Whitmore Dr
- 30109 Whitmore Rd
- 30206 Whitmore Rd
Your Personal Tour Guide
Ask me questions while you tour the home.