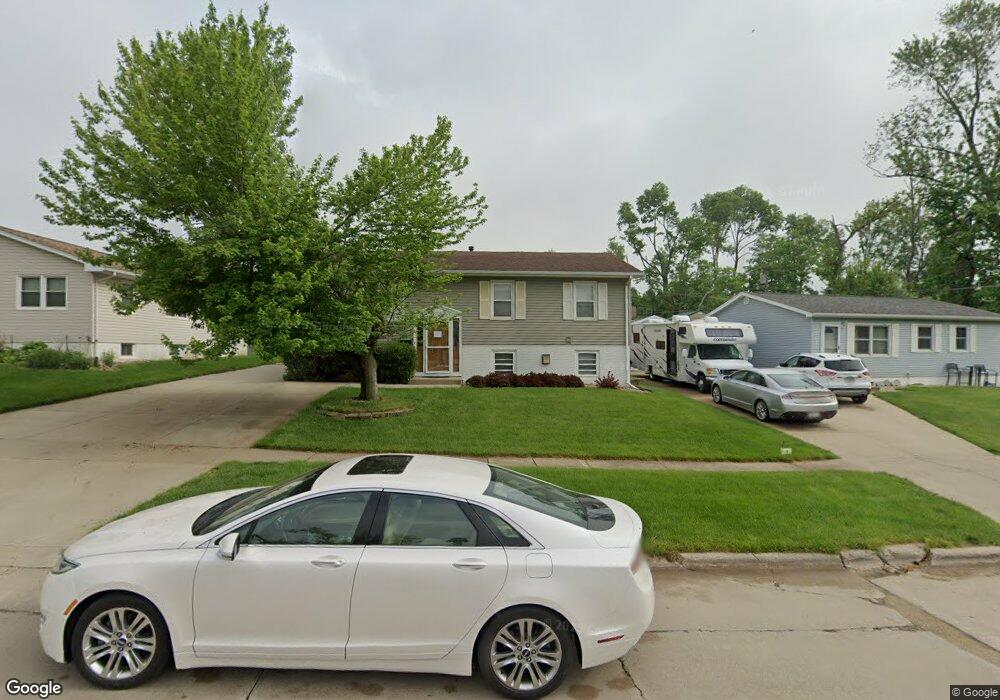
3008 2nd Ave SW Cedar Rapids, IA 52404
Estimated Value: $194,000 - $226,923
4
Beds
2
Baths
936
Sq Ft
$224/Sq Ft
Est. Value
About This Home
This home is located at 3008 2nd Ave SW, Cedar Rapids, IA 52404 and is currently estimated at $209,481, approximately $223 per square foot. 3008 2nd Ave SW is a home located in Linn County with nearby schools including Junction City Elementary School, Cleveland Elementary School, and Kentucky Tech - Ashland Reg Tech Center.
Ownership History
Date
Name
Owned For
Owner Type
Purchase Details
Closed on
Aug 6, 2007
Sold by
Burkhart Lori Marie and Burkhart Douglas E
Bought by
Abdullah Yehya and Abdullah Ayesha T
Current Estimated Value
Purchase Details
Closed on
Oct 5, 2005
Sold by
Household Fin Industrial Loan Co Of Ia
Bought by
Whiting Lori M
Home Financials for this Owner
Home Financials are based on the most recent Mortgage that was taken out on this home.
Original Mortgage
$96,000
Interest Rate
5.37%
Mortgage Type
Fannie Mae Freddie Mac
Purchase Details
Closed on
Jul 27, 2005
Sold by
Young Rick M
Bought by
Household Fin Industrial Loan Co Of Iowa
Purchase Details
Closed on
Sep 10, 1999
Sold by
Strehl Rhonda J and Strehl Michael J
Bought by
Young Rick M
Home Financials for this Owner
Home Financials are based on the most recent Mortgage that was taken out on this home.
Original Mortgage
$94,950
Interest Rate
7.77%
Create a Home Valuation Report for This Property
The Home Valuation Report is an in-depth analysis detailing your home's value as well as a comparison with similar homes in the area
Home Values in the Area
Average Home Value in this Area
Purchase History
| Date | Buyer | Sale Price | Title Company |
|---|---|---|---|
| Abdullah Yehya | $131,500 | None Available | |
| Whiting Lori M | $119,500 | -- | |
| Household Fin Industrial Loan Co Of Iowa | -- | -- | |
| Young Rick M | $106,000 | -- |
Source: Public Records
Mortgage History
| Date | Status | Borrower | Loan Amount |
|---|---|---|---|
| Previous Owner | Whiting Lori M | $96,000 | |
| Previous Owner | Young Rick M | $94,950 |
Source: Public Records
Tax History Compared to Growth
Tax History
| Year | Tax Paid | Tax Assessment Tax Assessment Total Assessment is a certain percentage of the fair market value that is determined by local assessors to be the total taxable value of land and additions on the property. | Land | Improvement |
|---|---|---|---|---|
| 2025 | $2,696 | $194,900 | $37,200 | $157,700 |
| 2024 | $2,994 | $178,500 | $33,900 | $144,600 |
| 2023 | $2,994 | $178,500 | $33,900 | $144,600 |
| 2022 | $2,614 | $154,200 | $33,900 | $120,300 |
| 2021 | $2,714 | $138,600 | $30,700 | $107,900 |
| 2020 | $2,714 | $134,900 | $29,100 | $105,800 |
| 2019 | $2,508 | $128,100 | $29,100 | $99,000 |
| 2018 | $2,432 | $128,100 | $29,100 | $99,000 |
| 2017 | $2,418 | $122,800 | $29,100 | $93,700 |
| 2016 | $2,441 | $118,200 | $27,400 | $90,800 |
| 2015 | $2,497 | $120,714 | $27,360 | $93,354 |
| 2014 | $2,312 | $120,714 | $27,360 | $93,354 |
| 2013 | $2,258 | $120,714 | $27,360 | $93,354 |
Source: Public Records
Map
Nearby Homes
- 3109 12th Ave SW
- 3013 Sue Ln NW
- 3403 1st Ave SW
- 2437 9th Ave SW
- 2433 8th Ave SW
- 2178 Chandler St SW
- 3416 Sue Ln NW
- 225 31st St NW
- 159 26th St NW
- 201 Edgewood Rd NW
- 3724 2nd Ave SW
- 232 27th St NW
- Remington - Cedar Rapids Plan at Whispering Pines
- Copeland Plan at Whispering Pines
- Meadowbrook - Cedar Rapids Plan at Stags Leap Estates
- Caldwell Plan at Stags Leap Estates
- Concord - Cedar Rapids Plan at Stags Leap Estates
- Yuma Expanded Plan at Whispering Pines
- Becker II Plan at Kirkwood Village - Kirk Wood Village
- Meadowbrook - Cedar Rapids Plan at Whispering Pines
- 3002 2nd Ave SW
- 3016 2nd Ave SW
- 141 31st St SW
- 135 31st St SW
- 3007 2nd Ave SW
- 3015 2nd Ave SW
- 3101 2nd Ave SW
- 129 31st St SW
- 310 31st St SW
- 3107 2nd Ave SW
- 411 31st St SW
- 318 31st St SW
- 3102 2nd Ave SW
- 123 31st St SW
- 2912 12th Ave SW
- 310 Foote St SW
- 3002 12th Ave SW
- 410 31st St SW
- 3108 2nd Ave SW
- 421 31st St SW