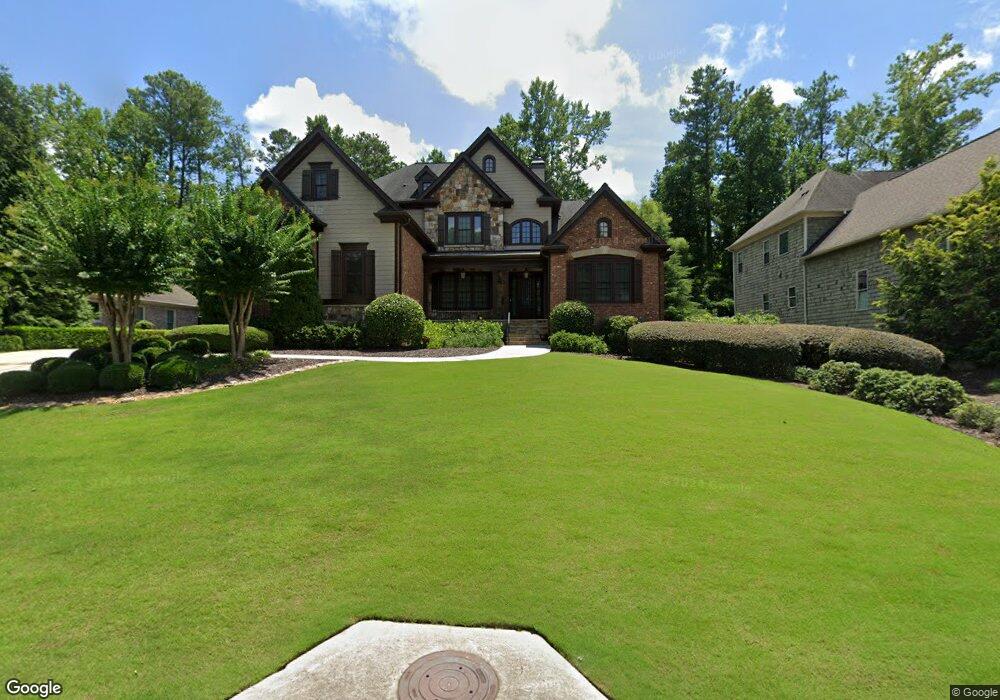
3008 Canton Pines Place Unit 16 Marietta, GA 30068
East Cobb NeighborhoodEstimated Value: $1,023,000 - $1,590,000
4
Beds
5
Baths
5,137
Sq Ft
$262/Sq Ft
Est. Value
About This Home
This home is located at 3008 Canton Pines Place Unit 16, Marietta, GA 30068 and is currently estimated at $1,347,868, approximately $262 per square foot. 3008 Canton Pines Place Unit 16 is a home located in Cobb County with nearby schools including Eastvalley Elementary School, East Cobb Middle School, and Wheeler High School.
Ownership History
Date
Name
Owned For
Owner Type
Purchase Details
Closed on
Jul 8, 2019
Sold by
Greenland Jean A
Bought by
Sullivan Chaneta and Sullivan Nikkor C
Current Estimated Value
Home Financials for this Owner
Home Financials are based on the most recent Mortgage that was taken out on this home.
Original Mortgage
$743,750
Outstanding Balance
$650,192
Interest Rate
3.82%
Mortgage Type
New Conventional
Estimated Equity
$697,676
Purchase Details
Closed on
Dec 27, 2018
Sold by
Conger Dorian Scott
Bought by
Greenland Jean
Purchase Details
Closed on
Feb 26, 2010
Sold by
Branch Banking & Trust Co
Bought by
Conger Dorian S and Greenland Jean
Home Financials for this Owner
Home Financials are based on the most recent Mortgage that was taken out on this home.
Original Mortgage
$350,000
Interest Rate
5%
Mortgage Type
New Conventional
Purchase Details
Closed on
Jun 12, 2009
Sold by
Nwh Construction Inc
Bought by
Bb & T
Create a Home Valuation Report for This Property
The Home Valuation Report is an in-depth analysis detailing your home's value as well as a comparison with similar homes in the area
Home Values in the Area
Average Home Value in this Area
Purchase History
| Date | Buyer | Sale Price | Title Company |
|---|---|---|---|
| Sullivan Chaneta | $875,000 | -- | |
| Greenland Jean | -- | -- | |
| Conger Dorian S | $645,000 | -- | |
| Bb & T | $735,000 | -- |
Source: Public Records
Mortgage History
| Date | Status | Borrower | Loan Amount |
|---|---|---|---|
| Open | Sullivan Chaneta | $743,750 | |
| Previous Owner | Conger Dorian S | $350,000 |
Source: Public Records
Tax History Compared to Growth
Tax History
| Year | Tax Paid | Tax Assessment Tax Assessment Total Assessment is a certain percentage of the fair market value that is determined by local assessors to be the total taxable value of land and additions on the property. | Land | Improvement |
|---|---|---|---|---|
| 2025 | $11,876 | $441,500 | $80,000 | $361,500 |
| 2024 | $11,885 | $441,500 | $80,000 | $361,500 |
| 2023 | $11,342 | $441,500 | $80,000 | $361,500 |
| 2022 | $11,577 | $423,496 | $80,000 | $343,496 |
| 2021 | $10,137 | $357,712 | $70,000 | $287,712 |
| 2020 | $8,984 | $305,036 | $70,000 | $235,036 |
| 2019 | $3,010 | $305,036 | $70,000 | $235,036 |
| 2018 | $3,010 | $305,036 | $70,000 | $235,036 |
| 2017 | $2,619 | $305,036 | $70,000 | $235,036 |
| 2016 | $2,656 | $314,784 | $70,000 | $244,784 |
| 2015 | $8,609 | $314,784 | $70,000 | $244,784 |
| 2014 | $8,074 | $288,000 | $0 | $0 |
Source: Public Records
Map
Nearby Homes
- 180 Blue Sky Dr
- 302 Chase Ln
- 3270 Brookview Dr
- 3220 Birchfield Trace
- 15 Vickwood Ct NE
- 3344 Brookview Dr
- 3070 Brookview Dr
- 2915 Sope Creek Dr
- 420 Greenfield Trace
- 11 Cecil Dr
- 2851 Dale Dr
- 29 Rhodes Dr
- 3365 Turtle Lake Dr SE
- 3040 Clearbrook Dr
- 2811 Georgian Terrace Unit 5
- 2790 Burtz Dr
- 529 Greystone Trail
- 3511 Brookview Dr
- 2431 Weatherford Ct
- 640 Maddie Way
- 3008 Canton Pines Place
- 3004 Canton Pines Place
- 3012 Canton Pines Place
- 104 Old Canton Rd
- 3005 Canton Pines Place
- 3022 Canton Pines Place
- 3013 Canton Pines Place
- 3032 Canton Pines Place Unit 13
- 3032 Canton Pines Place
- 3032 Canton Pines Place
- 94 Old Canton Rd
- 109 Old Canton Rd
- 3017 Canton Pines Place
- 2943 Old Sewell Rd
- 2960 Victoria Dr
- 3036 Canton Pines Place
- 151 Blue Sky Dr
- 150 Blue Sky Dr
- 3029 Canton Pines Place
- 3025 Canton Pines Place