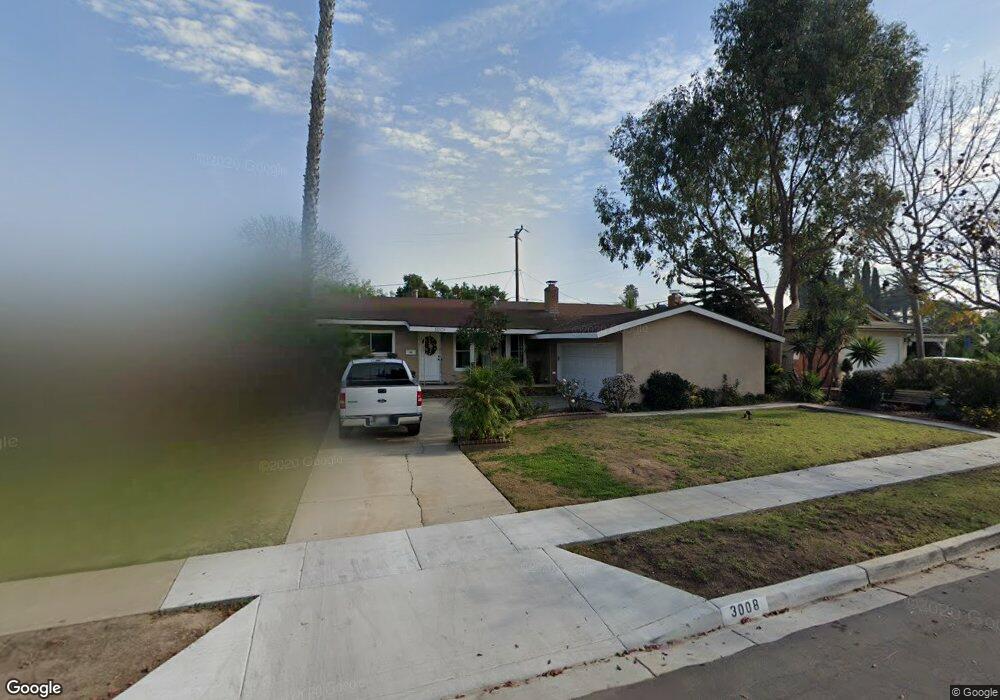
3008 Fernheath Ln Costa Mesa, CA 92626
Harbor Gateway NeighborhoodEstimated Value: $1,249,000 - $1,558,000
4
Beds
3
Baths
1,917
Sq Ft
$750/Sq Ft
Est. Value
About This Home
This home is located at 3008 Fernheath Ln, Costa Mesa, CA 92626 and is currently estimated at $1,436,904, approximately $749 per square foot. 3008 Fernheath Ln is a home located in Orange County with nearby schools including Killybrooke Elementary School, Costa Mesa High School, and Montessori Christian School.
Ownership History
Date
Name
Owned For
Owner Type
Purchase Details
Closed on
Nov 26, 2002
Sold by
Dollison Maurice and Dollison Cheryl
Bought by
Dollison Maurice Alan and Dollison Cheryl Lynn
Current Estimated Value
Purchase Details
Closed on
Jun 19, 1998
Sold by
Fairbanks Capital Corp
Bought by
Dollison Maurice and Dollison Cheryl
Home Financials for this Owner
Home Financials are based on the most recent Mortgage that was taken out on this home.
Original Mortgage
$201,300
Interest Rate
6.93%
Purchase Details
Closed on
Sep 22, 1997
Sold by
Edmundo Diaz and Edmundo Janice Diaz
Bought by
Fairbanks Capital Corp
Purchase Details
Closed on
Jul 3, 1997
Sold by
Lavey Enet
Bought by
Amram Hagai and Amram Aida
Purchase Details
Closed on
Jan 20, 1997
Sold by
Edmundo Diaz
Bought by
Lavey Nesan and Lavey Enet
Create a Home Valuation Report for This Property
The Home Valuation Report is an in-depth analysis detailing your home's value as well as a comparison with similar homes in the area
Home Values in the Area
Average Home Value in this Area
Purchase History
| Date | Buyer | Sale Price | Title Company |
|---|---|---|---|
| Dollison Maurice Alan | -- | -- | |
| Dollison Maurice | $224,000 | Fidelity National Title Co | |
| Fairbanks Capital Corp | $167,000 | Fidelity National Title | |
| Amram Hagai | -- | -- | |
| Lavey Nesan | -- | -- |
Source: Public Records
Mortgage History
| Date | Status | Borrower | Loan Amount |
|---|---|---|---|
| Previous Owner | Dollison Maurice | $201,300 |
Source: Public Records
Tax History Compared to Growth
Tax History
| Year | Tax Paid | Tax Assessment Tax Assessment Total Assessment is a certain percentage of the fair market value that is determined by local assessors to be the total taxable value of land and additions on the property. | Land | Improvement |
|---|---|---|---|---|
| 2025 | $4,555 | $350,685 | $245,601 | $105,084 |
| 2024 | $4,555 | $343,809 | $240,785 | $103,024 |
| 2023 | $4,378 | $337,068 | $236,064 | $101,004 |
| 2022 | $4,193 | $330,459 | $231,435 | $99,024 |
| 2021 | $4,048 | $323,980 | $226,897 | $97,083 |
| 2020 | $3,994 | $320,658 | $224,570 | $96,088 |
| 2019 | $3,907 | $314,371 | $220,167 | $94,204 |
| 2018 | $3,828 | $308,207 | $215,850 | $92,357 |
| 2017 | $3,766 | $302,164 | $211,617 | $90,547 |
| 2016 | $3,688 | $296,240 | $207,468 | $88,772 |
| 2015 | $3,651 | $291,791 | $204,352 | $87,439 |
| 2014 | $3,570 | $286,076 | $200,349 | $85,727 |
Source: Public Records
Map
Nearby Homes
- 3149 Sharon Ln
- 1387 Garlingford St
- 1585 Baker St
- 2957 Royal Palm Dr
- 1111 S Coast Dr Unit 18
- 3050 Madison Ave
- 2901 Royal Palm Dr
- 2865 Mendoza Dr
- 1081 Tulare Dr
- 3131 Lincoln Way
- 2737 Lorenzo Ave
- 1010 Valencia St
- 1110 Redding Ave
- 994 Valencia St
- 3119 Gibraltar Ave
- 3351 Via Trentino Unit 76
- 3104 Samoa Place
- 945 Brilliance Ln
- 403 Aura Dr
- 419 Aura Dr
- 3012 Fernheath Ln
- 3002 Fernheath Ln
- 3007 Murray Ln
- 3018 Fernheath Ln
- 3001 Murray Ln
- 3015 Murray Ln
- 3007 Fernheath Ln
- 3011 Fernheath Ln
- 3001 Fernheath Ln
- 3026 Fernheath Ln
- 3019 Fernheath Ln
- 3023 Murray Ln
- 3025 Fernheath Ln
- 3034 Fernheath Ln
- 1293 Baker St
- 1273 Baker St
- 1301 Baker St
- 3006 Donnybrook Ln
- 3012 Donnybrook Ln
- 3008 Murray Ln