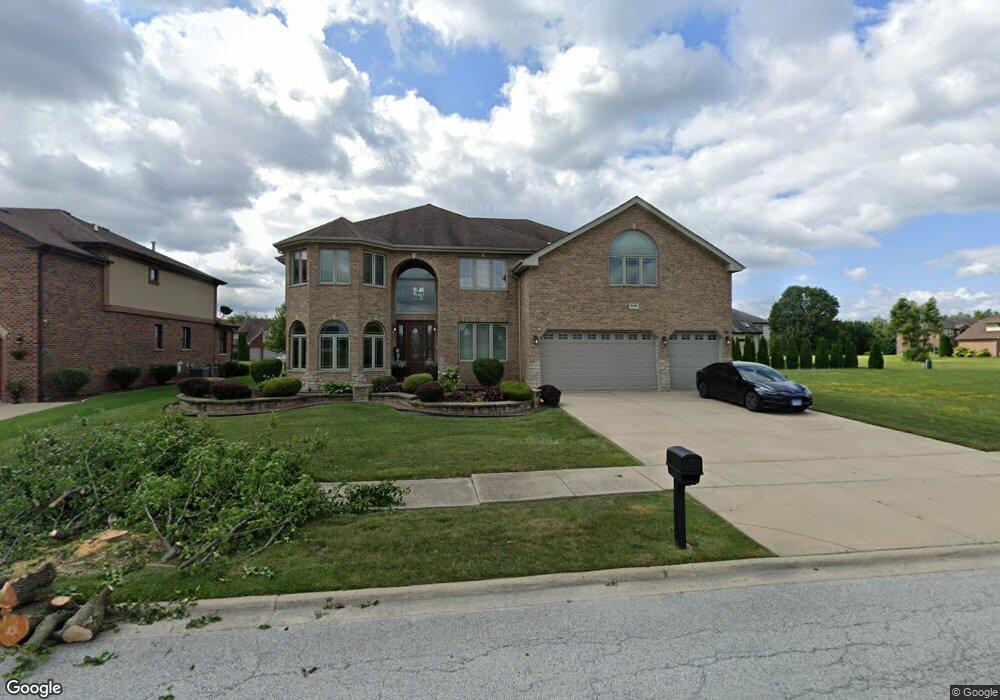
3008 Messina Dr Olympia Fields, IL 60461
Estimated Value: $506,861 - $612,000
5
Beds
6
Baths
4,298
Sq Ft
$129/Sq Ft
Est. Value
About This Home
This home is located at 3008 Messina Dr, Olympia Fields, IL 60461 and is currently estimated at $552,965, approximately $128 per square foot. 3008 Messina Dr is a home located in Cook County with nearby schools including Illinois School, Arcadia Elementary School, and Indiana Elementary School.
Ownership History
Date
Name
Owned For
Owner Type
Purchase Details
Closed on
Dec 8, 2017
Sold by
Clift Carolyn H
Bought by
Carolyn H Clift Revocable Living Trust
Current Estimated Value
Purchase Details
Closed on
Dec 20, 2014
Sold by
Thigpen Erica
Bought by
Clift Carolyn
Purchase Details
Closed on
Jun 12, 2013
Sold by
Kitchens Anthony R and Caradine Kitchens Monique Q
Bought by
Thigpen Erica and Cliff Carolyn
Purchase Details
Closed on
Dec 10, 2008
Sold by
Kitchens Anthony R
Bought by
Kitchens Anthony R and Caradine Kitchens Monique
Home Financials for this Owner
Home Financials are based on the most recent Mortgage that was taken out on this home.
Original Mortgage
$377,600
Interest Rate
7.25%
Mortgage Type
Unknown
Purchase Details
Closed on
Dec 5, 2008
Sold by
State Bank Of Countryside
Bought by
Kitchens Anthony R
Home Financials for this Owner
Home Financials are based on the most recent Mortgage that was taken out on this home.
Original Mortgage
$377,600
Interest Rate
7.25%
Mortgage Type
Unknown
Create a Home Valuation Report for This Property
The Home Valuation Report is an in-depth analysis detailing your home's value as well as a comparison with similar homes in the area
Home Values in the Area
Average Home Value in this Area
Purchase History
| Date | Buyer | Sale Price | Title Company |
|---|---|---|---|
| Carolyn H Clift Revocable Living Trust | -- | Attorney | |
| Clift Carolyn | -- | None Available | |
| Thigpen Erica | $350,000 | First American Title | |
| Kitchens Anthony R | -- | None Available | |
| Kitchens Anthony R | $472,000 | Cti |
Source: Public Records
Mortgage History
| Date | Status | Borrower | Loan Amount |
|---|---|---|---|
| Previous Owner | Kitchens Anthony R | $377,600 |
Source: Public Records
Tax History
| Year | Tax Paid | Tax Assessment Tax Assessment Total Assessment is a certain percentage of the fair market value that is determined by local assessors to be the total taxable value of land and additions on the property. | Land | Improvement |
|---|---|---|---|---|
| 2025 | $19,582 | $45,000 | $4,524 | $40,476 |
| 2024 | $19,582 | $45,000 | $4,524 | $40,476 |
| 2023 | $27,747 | $45,000 | $4,524 | $40,476 |
| 2022 | $27,747 | $48,857 | $4,524 | $44,333 |
| 2021 | $27,534 | $48,856 | $4,524 | $44,332 |
| 2020 | $25,169 | $48,856 | $4,524 | $44,332 |
| 2019 | $27,268 | $52,034 | $4,222 | $47,812 |
| 2018 | $27,075 | $52,034 | $4,222 | $47,812 |
| 2017 | $26,173 | $52,034 | $4,222 | $47,812 |
| 2016 | $21,850 | $43,511 | $3,920 | $39,591 |
| 2015 | $21,780 | $43,511 | $3,920 | $39,591 |
| 2014 | $21,288 | $43,511 | $3,920 | $39,591 |
| 2013 | $18,108 | $43,204 | $3,920 | $39,284 |
Source: Public Records
Map
Nearby Homes
- 20015 Delphi Dr
- 2904 Athena Ct
- 2908 Athena Ct
- 1816 Quail Ct
- 1741 Oak Lane Rd
- 3415 Vollmer Rd Unit 308
- 2937 Kathleen Ln
- 3427 Vollmer Rd Unit 205
- 3427 Vollmer Rd Unit 202
- 3427 Vollmer Rd Unit 209
- 3507 Park Place
- 3451 Ithaca Rd
- 3506 Ithaca Rd
- 20415 Doria Ln
- 20436 Arcadian Dr
- 2700 Chariot Ln
- 1437 Woodhollow Dr
- 31 Graymoor Ln
- 1421 Berry Ln
- 2935 Dartmouth Ln
Your Personal Tour Guide
Ask me questions while you tour the home.