3008 Red Cir Willow Spring, NC 27592
Pleasant Grove NeighborhoodEstimated Value: $384,680 - $433,000
3
Beds
3
Baths
2,093
Sq Ft
$191/Sq Ft
Est. Value
About This Home
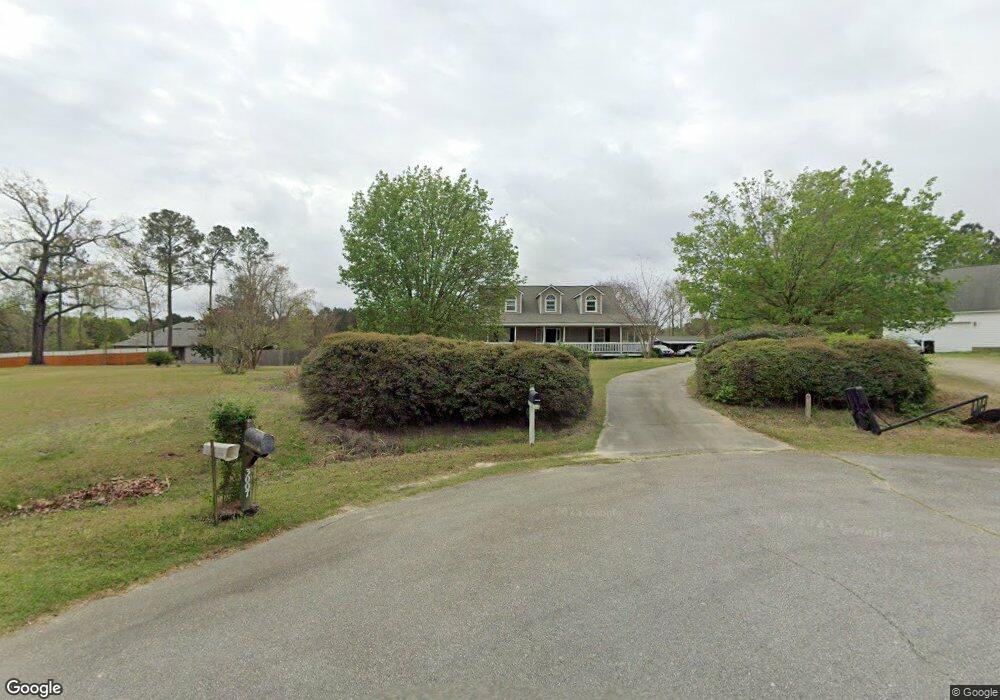
This home is located at 3008 Red Cir, Willow Spring, NC 27592 and is currently estimated at $400,170, approximately $191 per square foot. 3008 Red Cir is a home located in Johnston County with nearby schools including Dixon Road Elementary School, McGee's Crossroads Middle School, and West Johnston High School.
Ownership History
Date
Name
Owned For
Owner Type
Purchase Details
Closed on
May 16, 2017
Sold by
Hinson Jermy Robert and Hinson Kristina Lynn
Bought by
Bowers Tania M
Current Estimated Value
Home Financials for this Owner
Home Financials are based on the most recent Mortgage that was taken out on this home.
Original Mortgage
$199,862
Outstanding Balance
$165,867
Interest Rate
4.37%
Mortgage Type
FHA
Estimated Equity
$234,303
Purchase Details
Closed on
Mar 6, 2014
Sold by
Macgiffert John A and Macgiffert Deborah
Bought by
Hinson Jeremy Robert and Hinson Kristina Lynn
Home Financials for this Owner
Home Financials are based on the most recent Mortgage that was taken out on this home.
Original Mortgage
$166,920
Interest Rate
4.75%
Mortgage Type
FHA
Purchase Details
Closed on
Jan 17, 2001
Sold by
Macgiffert John A
Bought by
Blackman James
Create a Home Valuation Report for This Property
The Home Valuation Report is an in-depth analysis detailing your home's value as well as a comparison with similar homes in the area
Home Values in the Area
Average Home Value in this Area
Purchase History
| Date | Buyer | Sale Price | Title Company |
|---|---|---|---|
| Bowers Tania M | $204,000 | None Available | |
| Hinson Jeremy Robert | $170,000 | None Available | |
| Blackman James | $175,000 | -- |
Source: Public Records
Mortgage History
| Date | Status | Borrower | Loan Amount |
|---|---|---|---|
| Open | Bowers Tania M | $199,862 | |
| Previous Owner | Hinson Jeremy Robert | $166,920 |
Source: Public Records
Tax History
| Year | Tax Paid | Tax Assessment Tax Assessment Total Assessment is a certain percentage of the fair market value that is determined by local assessors to be the total taxable value of land and additions on the property. | Land | Improvement |
|---|---|---|---|---|
| 2025 | $2,382 | $375,180 | $83,980 | $291,200 |
| 2024 | $1,875 | $231,430 | $54,340 | $177,090 |
| 2023 | $1,817 | $231,430 | $54,340 | $177,090 |
| 2022 | $1,875 | $231,430 | $54,340 | $177,090 |
| 2021 | $1,875 | $231,430 | $54,340 | $177,090 |
| 2020 | $1,944 | $231,430 | $54,340 | $177,090 |
| 2019 | $1,898 | $231,430 | $54,340 | $177,090 |
| 2018 | $1,611 | $191,820 | $31,620 | $160,200 |
| 2017 | $1,617 | $191,820 | $31,620 | $160,200 |
| 2016 | $1,611 | $191,820 | $31,620 | $160,200 |
| 2015 | $1,611 | $191,820 | $31,620 | $160,200 |
| 2014 | $1,611 | $191,820 | $31,620 | $160,200 |
Source: Public Records
Map
Nearby Homes
- 3002 Red Cir
- 2004 Little Pond Place
- 15973 N Carolina 210
- 40 Broadhead Ct
- 71 Suzanne Dr
- 55 Edward Ct
- 33 Cabin Grove Ct
- 410 Penwood Rd
- 16622 N Carolina 210
- 76 Kingland Dr
- 369 Everland Pkwy
- 197 Silverside Dr
- 444 Everland Pkwy
- 376 Everland Pkwy
- 16 Keystone Ct
- 127 Wagon Trail
- 1145 Landmark Rd
- 1139 Landmark Rd
- 443 Tranquil Ln
- 420 Beulah Milton Dr
- 3006 Red Cir
- 3007 Red Cir
- 3003 Red Cir
- 2005 Little Pond Place
- 319 Deep Clay Cir
- 325 Deep Clay Cir
- 2003 Little Pond Place
- 3000 Red Cir
- 3001 Red Cir
- 2007 Little Pond Place
- 1008 Lake Path Rd
- 1016 Lake Path Rd
- 1006 Lake Path Rd
- 1018 Lake Path Rd
- 114 Lake Blanchard Dr
- 1009 Lake Path Rd
- 1020 Lake Path Rd
- 1011 Lake Path Rd
- 2008 Little Pond Place
- 1007 Lake Path Rd
Your Personal Tour Guide
Ask me questions while you tour the home.