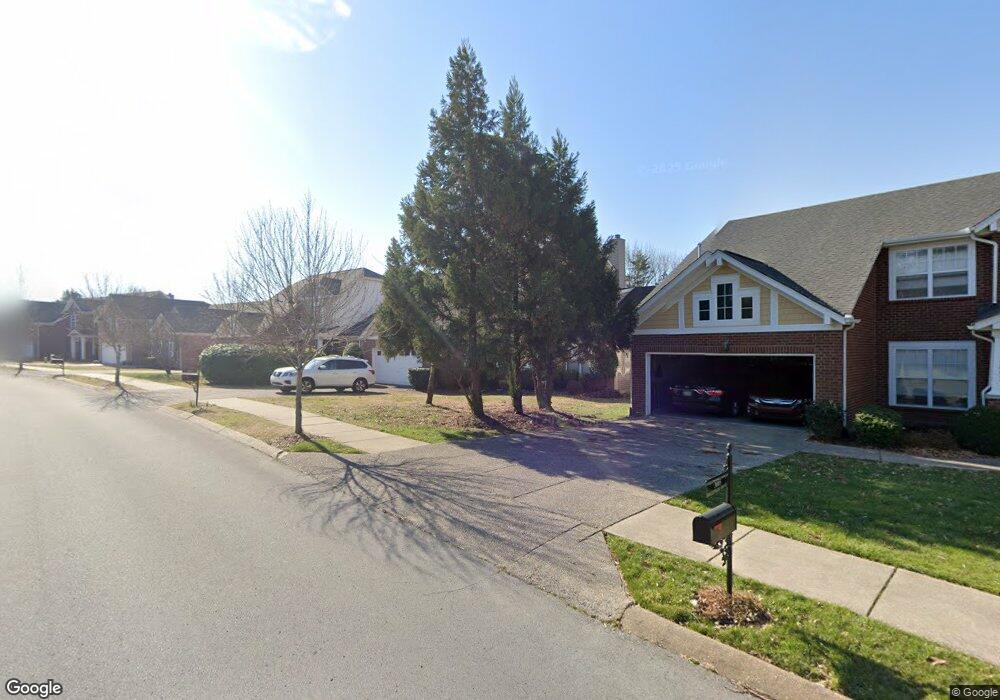
3009 Ballenger Dr Nolensville, TN 37135
Estimated Value: $599,000 - $674,000
--
Bed
3
Baths
2,372
Sq Ft
$266/Sq Ft
Est. Value
About This Home
This home is located at 3009 Ballenger Dr, Nolensville, TN 37135 and is currently estimated at $631,055, approximately $266 per square foot. 3009 Ballenger Dr is a home located in Williamson County with nearby schools including Nolensville Elementary School, Mill Creek Middle School, and Nolensville High School.
Ownership History
Date
Name
Owned For
Owner Type
Purchase Details
Closed on
Apr 25, 2019
Sold by
Rains Frank Norris
Bought by
Rains Keri L Halbert
Current Estimated Value
Home Financials for this Owner
Home Financials are based on the most recent Mortgage that was taken out on this home.
Original Mortgage
$300,000
Outstanding Balance
$263,753
Interest Rate
4.3%
Mortgage Type
New Conventional
Estimated Equity
$367,302
Purchase Details
Closed on
Nov 15, 2006
Sold by
Byers Scott B and Byers Lindsey
Bought by
Rains Frank and Rains Keri L
Home Financials for this Owner
Home Financials are based on the most recent Mortgage that was taken out on this home.
Original Mortgage
$251,850
Interest Rate
6.31%
Mortgage Type
Purchase Money Mortgage
Purchase Details
Closed on
Mar 17, 2005
Sold by
Beazer Homes Corp
Bought by
Byers Scott B and Byers Lindsey
Home Financials for this Owner
Home Financials are based on the most recent Mortgage that was taken out on this home.
Original Mortgage
$167,721
Interest Rate
5.75%
Mortgage Type
Purchase Money Mortgage
Create a Home Valuation Report for This Property
The Home Valuation Report is an in-depth analysis detailing your home's value as well as a comparison with similar homes in the area
Home Values in the Area
Average Home Value in this Area
Purchase History
| Date | Buyer | Sale Price | Title Company |
|---|---|---|---|
| Rains Keri L Halbert | -- | None Available | |
| Rains Frank | $251,850 | None Available | |
| Byers Scott B | $209,652 | -- |
Source: Public Records
Mortgage History
| Date | Status | Borrower | Loan Amount |
|---|---|---|---|
| Open | Rains Keri L Halbert | $300,000 | |
| Previous Owner | Rains Frank | $251,850 | |
| Previous Owner | Byers Scott B | $167,721 | |
| Closed | Byers Scott B | $36,000 |
Source: Public Records
Tax History Compared to Growth
Tax History
| Year | Tax Paid | Tax Assessment Tax Assessment Total Assessment is a certain percentage of the fair market value that is determined by local assessors to be the total taxable value of land and additions on the property. | Land | Improvement |
|---|---|---|---|---|
| 2025 | $1,982 | $148,725 | $41,250 | $107,475 |
| 2024 | $1,982 | $91,325 | $20,000 | $71,325 |
| 2023 | $1,982 | $91,325 | $20,000 | $71,325 |
| 2022 | $1,982 | $91,325 | $20,000 | $71,325 |
| 2021 | $1,982 | $91,325 | $20,000 | $71,325 |
| 2020 | $1,752 | $69,800 | $15,000 | $54,800 |
| 2019 | $1,655 | $69,800 | $15,000 | $54,800 |
| 2018 | $1,606 | $69,800 | $15,000 | $54,800 |
| 2017 | $1,592 | $69,800 | $15,000 | $54,800 |
| 2016 | $0 | $69,800 | $15,000 | $54,800 |
| 2015 | -- | $53,875 | $12,500 | $41,375 |
| 2014 | -- | $53,875 | $12,500 | $41,375 |
Source: Public Records
Map
Nearby Homes
- 3025 Ash Dale Ln
- 3051 Ash Dale Ln
- 3019 Ash Dale Ln
- 3027 Ash Dale Ln
- 904 Inglenook Ct
- 1228 Countryside Rd
- 813 Stonebrook Blvd
- 829 Stonebrook Blvd
- 607 Quarter Horse Ln
- 1016 Dortch Ln
- 1117 Millshed Dr
- 0 Nolensville Rd Unit RTC2807764
- 0 Nolensville Rd Unit RTC2818506
- 0 Bostic Unit RTC2516475
- 0 Nolensville Rd Unit RTC3017763
- 825 Piccadilly Dr
- 9918 Sam Donald Rd
- 1115 Oak Creek Dr
- 3231 Bradfield Dr
- 304 Thesing Ct
- 3005 Ballenger Dr
- 3013 Ballenger Dr
- 3001 Ballenger Dr
- 3017 Ballenger Dr
- 3008 Ballenger Dr
- 3012 Ballenger Dr
- 3004 Ballenger Dr
- 3021 Ballenger Dr
- 3016 Ballenger Dr
- 3000 Ballenger Dr
- 3020 Ballenger Dr
- 3025 Ballenger Dr
- 3028 Ballenger Dr
- 3029 Ballenger Dr
- 2354 Newsom Ln
- 2350 Newsom Ln
- 109 Mill Creek Ln
- 3032 Ballenger Dr
- 3033 Ballenger Dr
- 512 Cedar Brook Ln