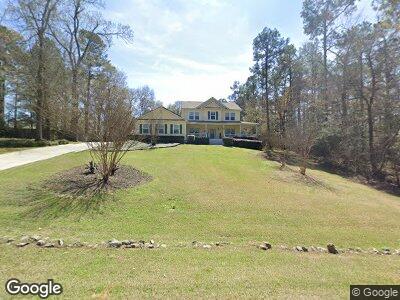
3009 Grey Fox Dr Hephzibah, GA 30815
Farmers Bridge NeighborhoodEstimated Value: $413,000 - $541,000
4
Beds
4
Baths
3,500
Sq Ft
$128/Sq Ft
Est. Value
About This Home
This home is located at 3009 Grey Fox Dr, Hephzibah, GA 30815 and is currently estimated at $446,984, approximately $127 per square foot. 3009 Grey Fox Dr is a home located in Richmond County with nearby schools including Hephzibah Middle School, Johnson Magnet, and Hephzibah High School.
Ownership History
Date
Name
Owned For
Owner Type
Purchase Details
Closed on
Nov 17, 2010
Sold by
Branch Michael and Branch Lisa
Bought by
Hartshorn Charles F and Hartshorn Lola M
Current Estimated Value
Home Financials for this Owner
Home Financials are based on the most recent Mortgage that was taken out on this home.
Original Mortgage
$234,500
Interest Rate
4.33%
Mortgage Type
VA
Purchase Details
Closed on
May 12, 2008
Sold by
Barrett Jane Henderson and Last Will & Testament Of Willi
Bought by
Branch Michael and Branch Lisa
Home Financials for this Owner
Home Financials are based on the most recent Mortgage that was taken out on this home.
Original Mortgage
$222,500
Interest Rate
5.84%
Mortgage Type
Construction
Purchase Details
Closed on
Apr 26, 1995
Sold by
Barrett William W
Bought by
Barrett William W
Create a Home Valuation Report for This Property
The Home Valuation Report is an in-depth analysis detailing your home's value as well as a comparison with similar homes in the area
Home Values in the Area
Average Home Value in this Area
Purchase History
| Date | Buyer | Sale Price | Title Company |
|---|---|---|---|
| Hartshorn Charles F | $234,500 | -- | |
| Branch Michael | $15,500 | None Available | |
| Barrett William W | -- | -- |
Source: Public Records
Mortgage History
| Date | Status | Borrower | Loan Amount |
|---|---|---|---|
| Open | Hartshon Charles | $39,475 | |
| Open | Hartshorn Charles F | $279,450 | |
| Closed | Hartshorn Charles F | $269,900 | |
| Closed | Hartshorn Charles F | $234,500 | |
| Previous Owner | Branch Michael | $22,000 | |
| Previous Owner | Branch Michael | $222,500 |
Source: Public Records
Tax History Compared to Growth
Tax History
| Year | Tax Paid | Tax Assessment Tax Assessment Total Assessment is a certain percentage of the fair market value that is determined by local assessors to be the total taxable value of land and additions on the property. | Land | Improvement |
|---|---|---|---|---|
| 2024 | $3,922 | $154,916 | $13,080 | $141,836 |
| 2023 | $3,922 | $150,592 | $13,080 | $137,512 |
| 2022 | $2,288 | $86,092 | $13,080 | $73,012 |
| 2021 | $2,337 | $86,192 | $13,080 | $73,112 |
| 2020 | $2,288 | $86,192 | $13,080 | $73,112 |
| 2019 | $2,456 | $86,192 | $13,080 | $73,112 |
| 2018 | $2,476 | $86,192 | $13,080 | $73,112 |
| 2017 | $2,460 | $86,192 | $13,080 | $73,112 |
| 2016 | $2,462 | $86,192 | $13,080 | $73,112 |
| 2015 | $2,484 | $86,192 | $13,080 | $73,112 |
| 2014 | $2,641 | $86,192 | $13,080 | $73,112 |
Source: Public Records
Map
Nearby Homes
- 3023 Grey Fox Dr
- 2250 Hephzibah - McBean Rd
- 2712 Big Dog Trail
- 2687 Big Dog Tr
- 2209 Hephzibah - McBean Rd
- 4612 Dunbarton Dr
- 4735 Storey Mill Rd
- 2423 Southdale Dr
- 4756 Storey Mill Rd
- 2019 Elite Ct
- 2016 Elite Ct
- 230 Willowton Ln
- 2408 Southdale Dr
- 2650&2652 New Hope Cir
- 2402 Southdale Dr
- 4503 Greystone Dr
- 2664 New Hope Cir
- 2662 New Hope Cir
- 2433 Patiller Rd
- 2648 New Hope Cir
- 3009 Grey Fox Dr
- 3007 Grey Fox Dr
- 1013 Pleasant Valley Dr
- 3003 Grey Fox Dr
- 3005 Grey Fox Dr
- 1015 Pleasant Valley Dr
- 1011 Pleasant Valley Dr
- 1017 Pleasant Valley Dr
- 3022 Grey Fox Dr
- 3024 Grey Fox Dr
- 3010 Grey Fox Dr
- 3008 Grey Fox Dr
- 1024 Pleasant Valley Dr
- 3040 Grey Fox Dr
- 3016 Grey Fox Dr
- 3042 Grey Fox Dr
- 3017 Grey Fox Dr
- 3018 Grey Fox Dr
- 3014 Grey Fox Dr
- 3012 Grey Fox Dr