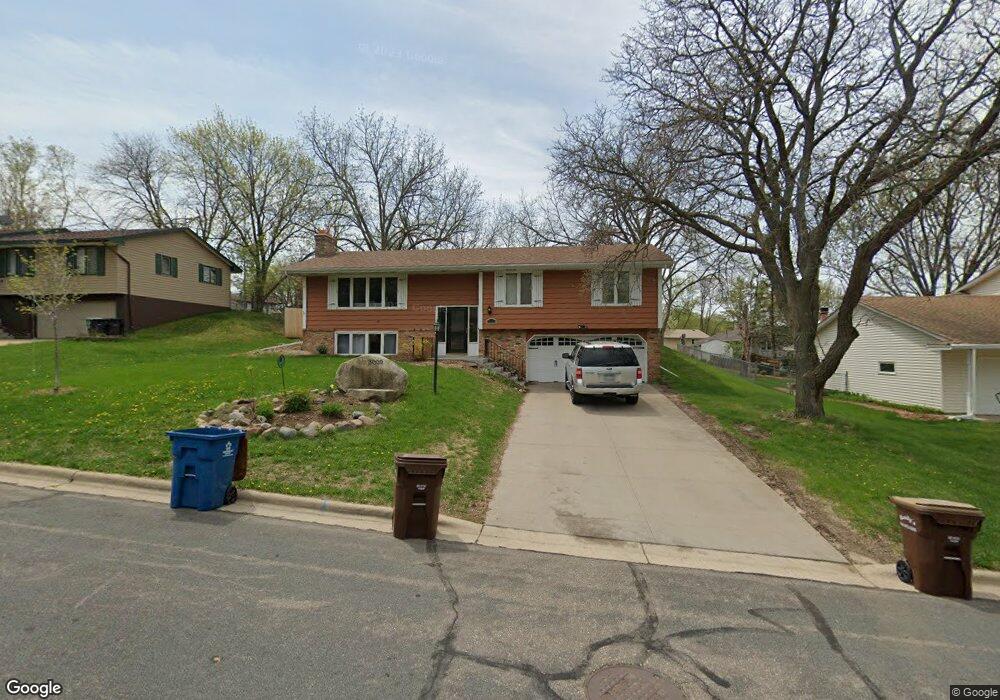
3009 Mcleod St Burnsville, MN 55337
Estimated Value: $412,033 - $440,000
4
Beds
3
Baths
1,948
Sq Ft
$217/Sq Ft
Est. Value
About This Home
This home is located at 3009 Mcleod St, Burnsville, MN 55337 and is currently estimated at $423,508, approximately $217 per square foot. 3009 Mcleod St is a home located in Dakota County with nearby schools including William Byrne Elementary School, Burnsville High School, and Gateway STEM Academy.
Ownership History
Date
Name
Owned For
Owner Type
Purchase Details
Closed on
Nov 21, 2018
Sold by
Rossow Tyson
Bought by
Freeze Shaun
Current Estimated Value
Home Financials for this Owner
Home Financials are based on the most recent Mortgage that was taken out on this home.
Original Mortgage
$285,000
Outstanding Balance
$251,107
Interest Rate
4.9%
Mortgage Type
New Conventional
Estimated Equity
$172,401
Purchase Details
Closed on
May 10, 2018
Sold by
Rossow Marilyn and Rossow Mark
Bought by
Rossow Tyson
Purchase Details
Closed on
Dec 27, 2011
Sold by
Miklya David M and Miklya Joni L
Bought by
Rossow Mark W and Rossow Marilyn M
Home Financials for this Owner
Home Financials are based on the most recent Mortgage that was taken out on this home.
Original Mortgage
$148,240
Interest Rate
3.91%
Mortgage Type
New Conventional
Purchase Details
Closed on
Jan 21, 1999
Sold by
Strike Harlow D and Strike Cecelia R
Bought by
Miklya David M and Miklya Coni L
Create a Home Valuation Report for This Property
The Home Valuation Report is an in-depth analysis detailing your home's value as well as a comparison with similar homes in the area
Home Values in the Area
Average Home Value in this Area
Purchase History
| Date | Buyer | Sale Price | Title Company |
|---|---|---|---|
| Freeze Shaun | $300,000 | Executive Title | |
| Rossow Tyson | -- | None Available | |
| Rossow Marilyn | -- | None Available | |
| Rossow Mark W | $185,300 | None Available | |
| Miklya David M | $151,500 | -- |
Source: Public Records
Mortgage History
| Date | Status | Borrower | Loan Amount |
|---|---|---|---|
| Open | Freeze Shaun | $285,000 | |
| Previous Owner | Rossow Mark W | $148,240 |
Source: Public Records
Tax History Compared to Growth
Tax History
| Year | Tax Paid | Tax Assessment Tax Assessment Total Assessment is a certain percentage of the fair market value that is determined by local assessors to be the total taxable value of land and additions on the property. | Land | Improvement |
|---|---|---|---|---|
| 2024 | $4,044 | $387,200 | $88,000 | $299,200 |
| 2023 | $4,044 | $386,200 | $88,100 | $298,100 |
| 2022 | $3,862 | $378,000 | $87,900 | $290,100 |
| 2021 | $3,526 | $322,100 | $76,400 | $245,700 |
| 2020 | $3,704 | $317,200 | $72,800 | $244,400 |
| 2019 | $3,380 | $302,500 | $69,300 | $233,200 |
| 2018 | $3,424 | $281,400 | $66,000 | $215,400 |
| 2017 | $3,221 | $267,100 | $62,900 | $204,200 |
| 2016 | $3,389 | $246,300 | $59,900 | $186,400 |
| 2015 | $3,169 | $248,500 | $58,100 | $190,400 |
| 2014 | -- | $243,000 | $57,100 | $185,900 |
| 2013 | -- | $220,200 | $52,300 | $167,900 |
Source: Public Records
Map
Nearby Homes
- 3017 Mcleod St
- 11459 Galtier Dr
- 11902 River Hills Cir
- 4427 Cinnamon Ridge Cir
- 4425 Cinnamon Ridge Cir
- 4463 Cinnamon Ridge Cir
- 3309 Red Oak Cir N
- 11900 Highland View Cir
- 11921 Baypoint Dr
- 4413 Slater Rd
- 4632 Westwood Ln
- 2200 Horizon Rd
- 11036 27th Ave S
- 10934 Southview Dr
- 11017 27th Ave S
- 11115 Carver Ct
- 2001 Woods Ln
- 4774 Slater Rd
- 319 River Woods Ln
- 1853 Riverwood Dr Unit 4
- 3013 Mcleod St
- 3005 Mcleod St
- 11611 River Hills Dr
- 11613 River Hills Dr
- 11616 Selkirk Ave
- 3010 Mcleod St
- 3006 Mcleod St
- 11615 River Hills Dr
- 3014 Mcleod St
- 3101 Mcleod St
- 11604 River Hills Dr
- 3018 Mcleod St
- 11617 Selkirk Ave
- 11618 Selkirk Ave
- 11617 River Hills Dr
- 11541 River Hills Dr
- 3100 Mcleod St
- 2907 Mcleod St
- 11619 River Hills Dr
- 11610 Ravoux Ct