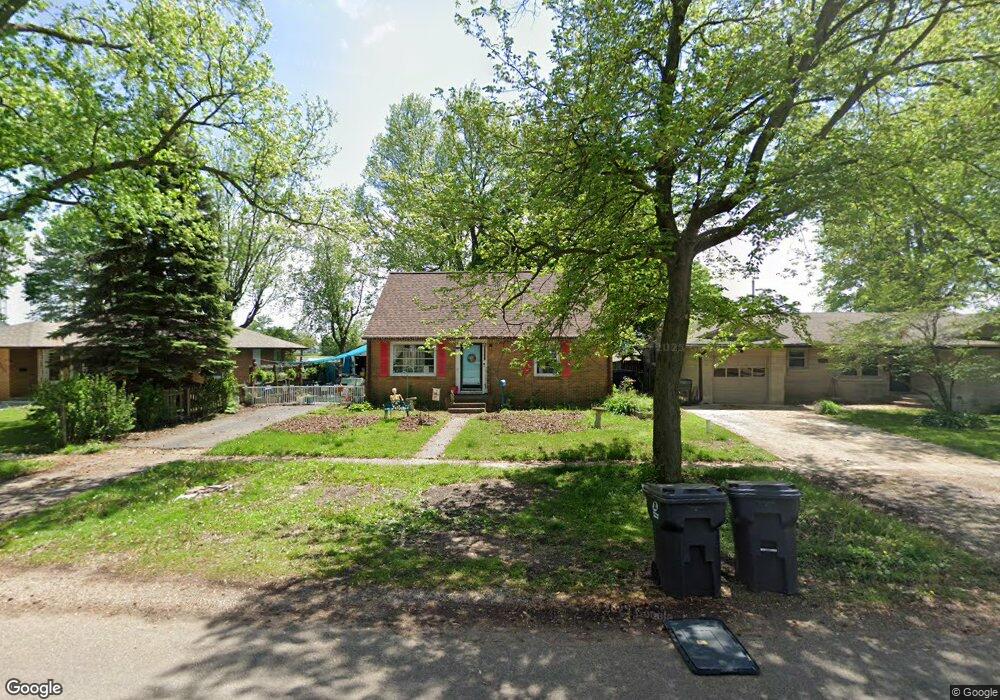
3009 Oak Ave Mattoon, IL 61938
Estimated Value: $118,000 - $199,000
4
Beds
2
Baths
972
Sq Ft
$161/Sq Ft
Est. Value
About This Home
This home is located at 3009 Oak Ave, Mattoon, IL 61938 and is currently estimated at $156,822, approximately $161 per square foot. 3009 Oak Ave is a home located in Coles County with nearby schools including Mattoon High School and St Mary School.
Ownership History
Date
Name
Owned For
Owner Type
Purchase Details
Closed on
Dec 15, 2021
Sold by
Land Trust
Bought by
Diepholz Family Limited Liability Company Ser
Current Estimated Value
Purchase Details
Closed on
Mar 29, 2017
Sold by
Edwards Gabriel C
Bought by
The First National Bank
Purchase Details
Closed on
Oct 15, 2008
Sold by
Gregory Leslie I and Wickman Leslie I
Bought by
The First National Bank
Purchase Details
Closed on
Jul 19, 2005
Sold by
Greentree Servicing Llc
Bought by
First National Bank Of Mulberry Grove and Trust Agreement No 095
Home Financials for this Owner
Home Financials are based on the most recent Mortgage that was taken out on this home.
Original Mortgage
$750,100
Interest Rate
6.25%
Mortgage Type
Purchase Money Mortgage
Purchase Details
Closed on
Apr 12, 2005
Sold by
Burcham Tab A and Burcham Jonalyn
Bought by
Green Tree Servicing Llc and Conseco Finance Servicing Corp
Create a Home Valuation Report for This Property
The Home Valuation Report is an in-depth analysis detailing your home's value as well as a comparison with similar homes in the area
Home Values in the Area
Average Home Value in this Area
Purchase History
| Date | Buyer | Sale Price | Title Company |
|---|---|---|---|
| Diepholz Family Limited Liability Company Ser | -- | None Listed On Document | |
| The First National Bank | -- | -- | |
| The First National Bank | -- | None Available | |
| First National Bank Of Mulberry Grove | $50,000 | None Available | |
| Green Tree Servicing Llc | -- | None Available |
Source: Public Records
Mortgage History
| Date | Status | Borrower | Loan Amount |
|---|---|---|---|
| Previous Owner | First National Bank Of Mulberry Grove | $750,100 |
Source: Public Records
Tax History
| Year | Tax Paid | Tax Assessment Tax Assessment Total Assessment is a certain percentage of the fair market value that is determined by local assessors to be the total taxable value of land and additions on the property. | Land | Improvement |
|---|---|---|---|---|
| 2024 | $3,375 | $39,641 | $8,359 | $31,282 |
| 2023 | $3,049 | $35,393 | $7,463 | $27,930 |
| 2022 | $3,049 | $34,809 | $7,340 | $27,469 |
| 2021 | $3,058 | $31,973 | $6,742 | $25,231 |
| 2020 | $3,025 | $33,127 | $6,985 | $26,142 |
| 2019 | $2,979 | $31,973 | $6,742 | $25,231 |
| 2018 | $2,926 | $31,973 | $6,742 | $25,231 |
| 2017 | $2,916 | $31,973 | $6,742 | $25,231 |
| 2016 | $2,854 | $31,973 | $6,742 | $25,231 |
| 2015 | $2,815 | $31,973 | $6,742 | $25,231 |
| 2014 | $2,815 | $31,973 | $6,742 | $25,231 |
| 2013 | $2,815 | $31,973 | $6,742 | $25,231 |
Source: Public Records
Map
Nearby Homes
- 3112 Oak Ave
- 3412 Willow Dr
- 3304 Marion Ave
- 916 S 36th St
- 3512 Walnut Ave
- 716 S 24th St
- 2800 Pine Ave
- 2505 Pine Ave
- 3216 Western Ave
- 2502 Pine Ave
- 113 S 25th St
- 2221 Charleston Ave
- 109 N 26th St
- 3433 Western Ave
- 2617 Richmond Ave
- 3020 Champaign Ave
- 2720 Champaign Ave
- 2305 Richmond Ave
- 2800 Shelby Ave
- 521 S 17th St
Your Personal Tour Guide
Ask me questions while you tour the home.