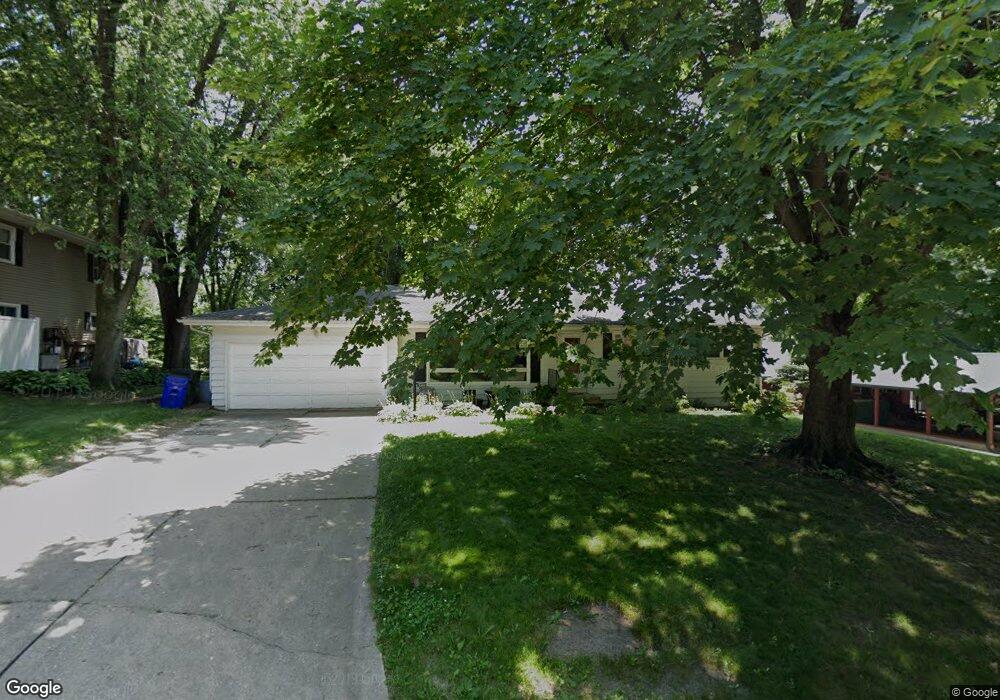
3009 Ridgemore Dr SE Cedar Rapids, IA 52403
Bever Park NeighborhoodEstimated Value: $248,000 - $306,000
3
Beds
3
Baths
2,295
Sq Ft
$124/Sq Ft
Est. Value
About This Home
This home is located at 3009 Ridgemore Dr SE, Cedar Rapids, IA 52403 and is currently estimated at $284,214, approximately $123 per square foot. 3009 Ridgemore Dr SE is a home located in Linn County with nearby schools including Erskine Elementary School, McKinley STEAM Academy, and George Washington High School.
Ownership History
Date
Name
Owned For
Owner Type
Purchase Details
Closed on
Jun 26, 2013
Sold by
Vanetten Marilyn F
Bought by
Vanhemert Gary L and Vanhemert Van Hemert
Current Estimated Value
Purchase Details
Closed on
Mar 19, 2012
Sold by
Abel Investments Inc
Bought by
Draker Danielle M
Home Financials for this Owner
Home Financials are based on the most recent Mortgage that was taken out on this home.
Original Mortgage
$19,500
Interest Rate
3.88%
Mortgage Type
Unknown
Purchase Details
Closed on
Jan 26, 2010
Sold by
Abel Investments Inc
Bought by
Draker Danielle Marie
Home Financials for this Owner
Home Financials are based on the most recent Mortgage that was taken out on this home.
Original Mortgage
$159,900
Interest Rate
5.3%
Mortgage Type
Seller Take Back
Purchase Details
Closed on
Feb 21, 2008
Sold by
Kelly Mary
Bought by
Abel Investments Inc
Create a Home Valuation Report for This Property
The Home Valuation Report is an in-depth analysis detailing your home's value as well as a comparison with similar homes in the area
Home Values in the Area
Average Home Value in this Area
Purchase History
| Date | Buyer | Sale Price | Title Company |
|---|---|---|---|
| Vanhemert Gary L | $75,000 | None Available | |
| Draker Danielle M | $180,000 | None Available | |
| Draker Danielle Marie | $179,900 | None Available | |
| Abel Investments Inc | $141,500 | None Available |
Source: Public Records
Mortgage History
| Date | Status | Borrower | Loan Amount |
|---|---|---|---|
| Previous Owner | Draker Danielle M | $19,500 | |
| Previous Owner | Draker Danielle Marie | $159,900 |
Source: Public Records
Tax History Compared to Growth
Tax History
| Year | Tax Paid | Tax Assessment Tax Assessment Total Assessment is a certain percentage of the fair market value that is determined by local assessors to be the total taxable value of land and additions on the property. | Land | Improvement |
|---|---|---|---|---|
| 2025 | $3,964 | $250,300 | $43,600 | $206,700 |
| 2024 | $4,120 | $224,000 | $43,600 | $180,400 |
| 2023 | $4,120 | $224,000 | $43,600 | $180,400 |
| 2022 | $3,892 | $195,300 | $39,600 | $155,700 |
| 2021 | $4,076 | $187,900 | $39,600 | $148,300 |
| 2020 | $4,076 | $184,700 | $39,600 | $145,100 |
| 2019 | $3,398 | $170,800 | $35,600 | $135,200 |
| 2018 | $3,304 | $157,600 | $35,600 | $122,000 |
| 2017 | $3,208 | $147,300 | $35,600 | $111,700 |
| 2016 | $3,254 | $153,100 | $35,600 | $117,500 |
| 2015 | $3,252 | $152,855 | $35,640 | $117,215 |
| 2014 | $3,252 | $157,196 | $35,640 | $121,556 |
| 2013 | $3,274 | $157,196 | $35,640 | $121,556 |
Source: Public Records
Map
Nearby Homes
- 431 30th St SE
- 18 Blake Terrace SE
- 237 34th St SE
- 415 35th St SE
- 3200 Mound Ave SE
- 639 32nd St SE
- 380 Indiandale Rd SE
- 3223 Mound Ave SE
- 651 34th St SE
- 2241 Linden Dr SE
- 654 34th St SE
- 435 Forest Dr SE
- 637 Grant Wood Dr SE
- 3830 Skylark Ln SE
- 700 Memorial Dr SE
- 654 26th St SE
- 2251 Bever Ave SE
- 440 Liberty Dr SE
- 2700 Mount Vernon Rd SE
- 505 Forest Dr SE
- 3001 Ridgemore Dr SE
- 3017 Ridgemore Dr SE
- 348 30th St SE
- 3025 Ridgemore Dr SE
- 3002 Ridgemore Dr SE
- 355 31st St SE
- 351 31st St SE
- 3024 Ridgemore Dr SE
- 345 30th St SE
- 3033 Ridgemore Dr SE
- 339 30th St SE
- 356 30th St SE
- 349 30th St SE
- 320 30th St SE
- 351 30th St SE
- 3032 Ridgemore Dr SE
- 333 30th St SE
- 353 30th St SE
- 359 31st St SE
- 355 30th St SE