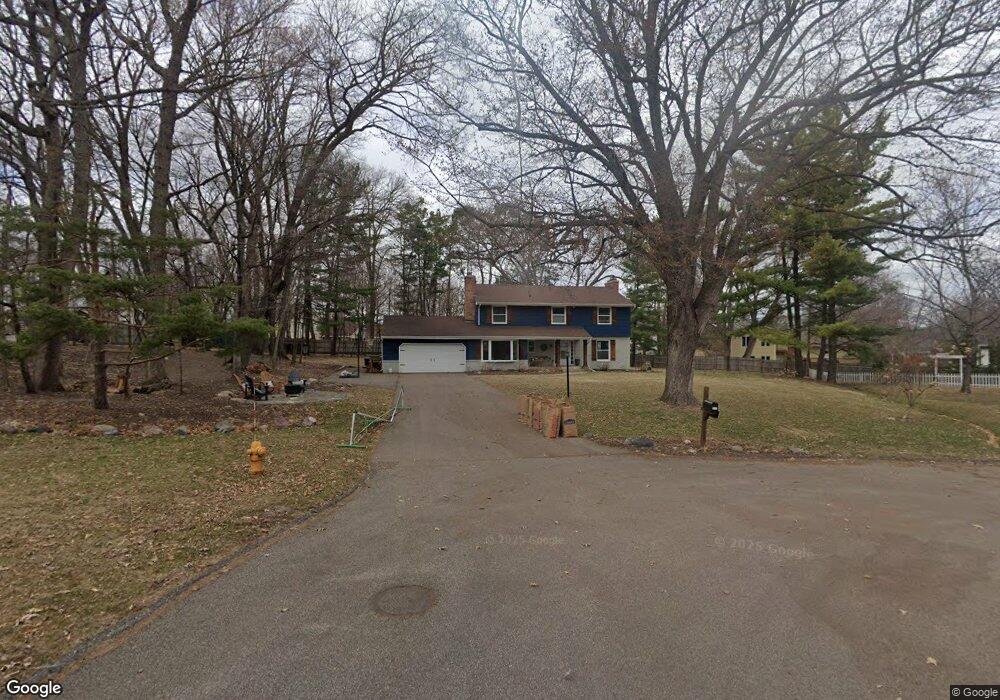
3009 Walnut Grove Ln N Plymouth, MN 55447
Estimated Value: $671,000 - $706,057
4
Beds
3
Baths
2,674
Sq Ft
$257/Sq Ft
Est. Value
About This Home
This home is located at 3009 Walnut Grove Ln N, Plymouth, MN 55447 and is currently estimated at $686,014, approximately $256 per square foot. 3009 Walnut Grove Ln N is a home located in Hennepin County with nearby schools including Oakwood Elementary School, Wayzata Central Middle School, and Wayzata High School.
Ownership History
Date
Name
Owned For
Owner Type
Purchase Details
Closed on
Mar 20, 2017
Sold by
Vulcan Revocable Llc
Bought by
Parr Rose E and Parr Holly A
Current Estimated Value
Home Financials for this Owner
Home Financials are based on the most recent Mortgage that was taken out on this home.
Original Mortgage
$408,500
Outstanding Balance
$338,750
Interest Rate
4.17%
Mortgage Type
New Conventional
Estimated Equity
$347,264
Purchase Details
Closed on
Sep 12, 2016
Sold by
Buffalohead Eric L and Buffalohead Joni M
Bought by
Northern Realty Ventures Llc
Home Financials for this Owner
Home Financials are based on the most recent Mortgage that was taken out on this home.
Original Mortgage
$500
Interest Rate
3.43%
Mortgage Type
Purchase Money Mortgage
Purchase Details
Closed on
May 27, 2016
Sold by
Buffalohead Joni M and Buffalohead Eric L
Bought by
Us Bank National Association
Purchase Details
Closed on
Jun 15, 2005
Sold by
Hunter Thomas S and Hunter Susan T
Bought by
Buffalohead Eric and Buffalohead Joni
Create a Home Valuation Report for This Property
The Home Valuation Report is an in-depth analysis detailing your home's value as well as a comparison with similar homes in the area
Home Values in the Area
Average Home Value in this Area
Purchase History
| Date | Buyer | Sale Price | Title Company |
|---|---|---|---|
| Parr Rose E | $430,000 | None Available | |
| Northern Realty Ventures Llc | $15,000 | None Available | |
| Us Bank National Association | $236,350 | None Available | |
| Buffalohead Eric | $477,000 | -- |
Source: Public Records
Mortgage History
| Date | Status | Borrower | Loan Amount |
|---|---|---|---|
| Open | Parr Rose E | $408,500 | |
| Previous Owner | Northern Realty Ventures Llc | $500 |
Source: Public Records
Tax History Compared to Growth
Tax History
| Year | Tax Paid | Tax Assessment Tax Assessment Total Assessment is a certain percentage of the fair market value that is determined by local assessors to be the total taxable value of land and additions on the property. | Land | Improvement |
|---|---|---|---|---|
| 2024 | $7,386 | $630,000 | $173,300 | $456,700 |
| 2023 | $6,632 | $597,300 | $131,300 | $466,000 |
| 2022 | $6,122 | $580,000 | $147,000 | $433,000 |
| 2021 | $5,874 | $497,000 | $134,000 | $363,000 |
| 2020 | $5,747 | $479,000 | $121,000 | $358,000 |
| 2019 | $5,417 | $455,000 | $113,000 | $342,000 |
| 2018 | $5,398 | $429,000 | $107,000 | $322,000 |
| 2017 | $4,967 | $391,000 | $111,000 | $280,000 |
| 2016 | $4,904 | $376,000 | $107,000 | $269,000 |
| 2015 | $4,923 | $369,000 | $105,000 | $264,000 |
| 2014 | -- | $332,000 | $100,000 | $232,000 |
Source: Public Records
Map
Nearby Homes
- 18525 County Road 24
- 18500 32nd Ave N
- 2915 Alvarado Ln N
- 18940 33rd Ave N
- 2625 Alvarado Ln N
- 17820 30th Ave N
- 3445 Zircon Ln N
- 3400 Shadyview Ln N
- 18715 24th Ave N
- 340 Ridge Cir
- 1492 Hunter Dr
- 3765 Yellowstone Ln N
- 2022 Holy Name Dr
- 24x1 Holy Name Dr
- 24x4 Holy Name Dr
- 1560 Hunter Dr
- 2040 Vagabond Ln N
- 3615 Lawndale Ln N Unit 32
- 3709 Queensland Ln N
- 18905 39th Ave N
- 3011 Walnut Grove Ln N
- 18625 County Road 24
- 3007 Walnut Grove Ln N
- 18615 County Road 24
- 3000 Xanthus Ln N
- 3015 Xanthus Ln N
- 18605 County Road 24
- 3015 Walnut Grove Ln N
- 3025 Xanthus Ln N
- 2945 Walnut Grove Ln N
- 2950 Xanthus Ln N
- 3025 Walnut Grove Ln N
- 18720 30th Ave N
- 2935 Walnut Grove Ln N
- 2940 Xanthus Ln N
- 18745 County Road 24
- 18725 30th Ave N
- 18640 County Road 24
- 18515 County Road 24
- 2940 Walnut Grove Ln N