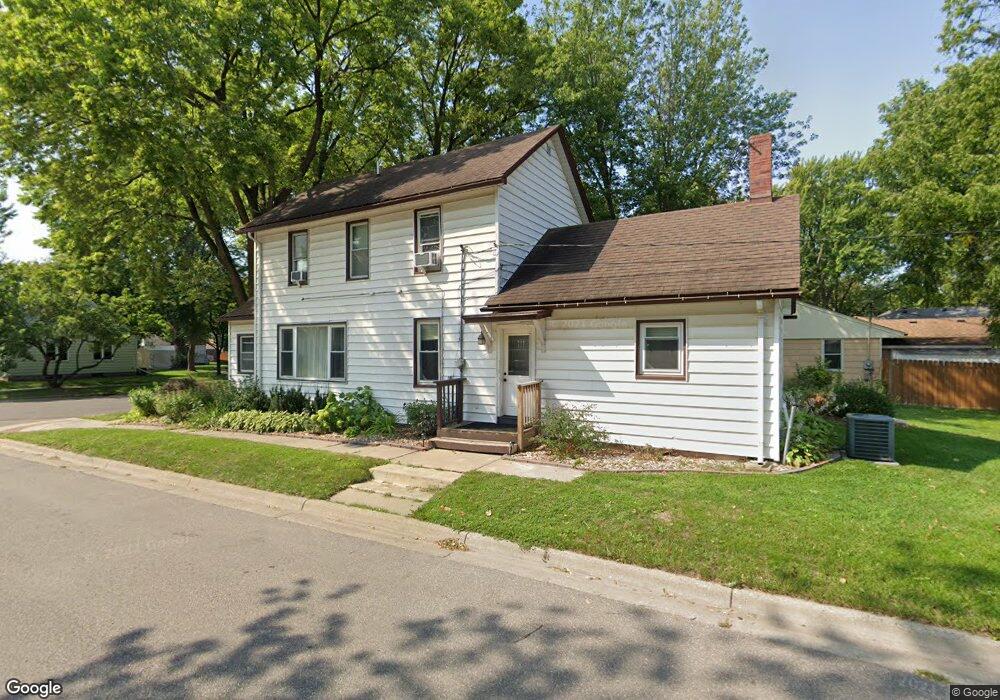
301 3rd St W Jordan, MN 55352
Estimated Value: $274,000 - $306,000
2
Beds
2
Baths
1,482
Sq Ft
$193/Sq Ft
Est. Value
About This Home
This home is located at 301 3rd St W, Jordan, MN 55352 and is currently estimated at $285,323, approximately $192 per square foot. 301 3rd St W is a home located in Scott County with nearby schools including Jordan Elementary School, Jordan Middle School, and Jordan High School.
Ownership History
Date
Name
Owned For
Owner Type
Purchase Details
Closed on
Apr 23, 2019
Sold by
Walters Jenni N and Walters Bryan
Bought by
Michaels Brianna and Michaels Mark
Current Estimated Value
Home Financials for this Owner
Home Financials are based on the most recent Mortgage that was taken out on this home.
Original Mortgage
$199,820
Outstanding Balance
$77,408
Interest Rate
4%
Mortgage Type
Stand Alone Second
Estimated Equity
$207,915
Purchase Details
Closed on
Mar 29, 2010
Sold by
Johns Amy R and Johns Peter
Bought by
Klinger Jenni N
Purchase Details
Closed on
Oct 28, 2003
Sold by
River Run Properties Llc
Bought by
Jabs Paul and Simaonas Michele M
Purchase Details
Closed on
Sep 12, 1997
Sold by
Hennen Duane and Hennen Diane
Bought by
Cobb Walter J and Cobb Patricia A
Create a Home Valuation Report for This Property
The Home Valuation Report is an in-depth analysis detailing your home's value as well as a comparison with similar homes in the area
Home Values in the Area
Average Home Value in this Area
Purchase History
| Date | Buyer | Sale Price | Title Company |
|---|---|---|---|
| Michaels Brianna | $206,000 | Carver Cnty Abstract & Ttl C | |
| Klinger Jenni N | $155,000 | -- | |
| Jabs Paul | $125,000 | -- | |
| Cobb Walter J | $65,900 | -- |
Source: Public Records
Mortgage History
| Date | Status | Borrower | Loan Amount |
|---|---|---|---|
| Open | Michaels Brianna | $199,820 | |
| Closed | Michaels Brianna | $199,820 |
Source: Public Records
Tax History
| Year | Tax Paid | Tax Assessment Tax Assessment Total Assessment is a certain percentage of the fair market value that is determined by local assessors to be the total taxable value of land and additions on the property. | Land | Improvement |
|---|---|---|---|---|
| 2025 | $2,640 | $256,400 | $53,200 | $203,200 |
| 2024 | $2,826 | $229,700 | $49,700 | $180,000 |
| 2023 | $3,040 | $230,800 | $49,700 | $181,100 |
| 2022 | $2,172 | $263,800 | $55,200 | $208,600 |
| 2021 | $2,176 | $166,400 | $41,100 | $125,300 |
| 2020 | $2,040 | $166,200 | $37,900 | $128,300 |
| 2019 | $4,278 | $154,100 | $36,300 | $117,800 |
| 2018 | $5,006 | $0 | $0 | $0 |
| 2016 | $3,450 | $0 | $0 | $0 |
| 2014 | -- | $0 | $0 | $0 |
Source: Public Records
Map
Nearby Homes
- 108 3rd St W
- 1XX Highway 169
- 712 Syndicate St
- 1X Highway 169
- 4X Valley View Dr
- 6X Valley View Dr
- 2X Valley View Dr
- 1X Valley View Dr
- 5X Valley View Dr
- 309 Arabian Dr
- 915 7th St Unit 8
- 201 Firewatch Dr
- 6305 W 190th Street (7acres)
- 211 Clover Ct
- 1031 Homestead Dr
- 6305 X 15A W 190th St
- 6305 W 190th Street (22 Acres)
- 408 Bentley Ct
- 1264 Edge Way
- 1248 Edge Way