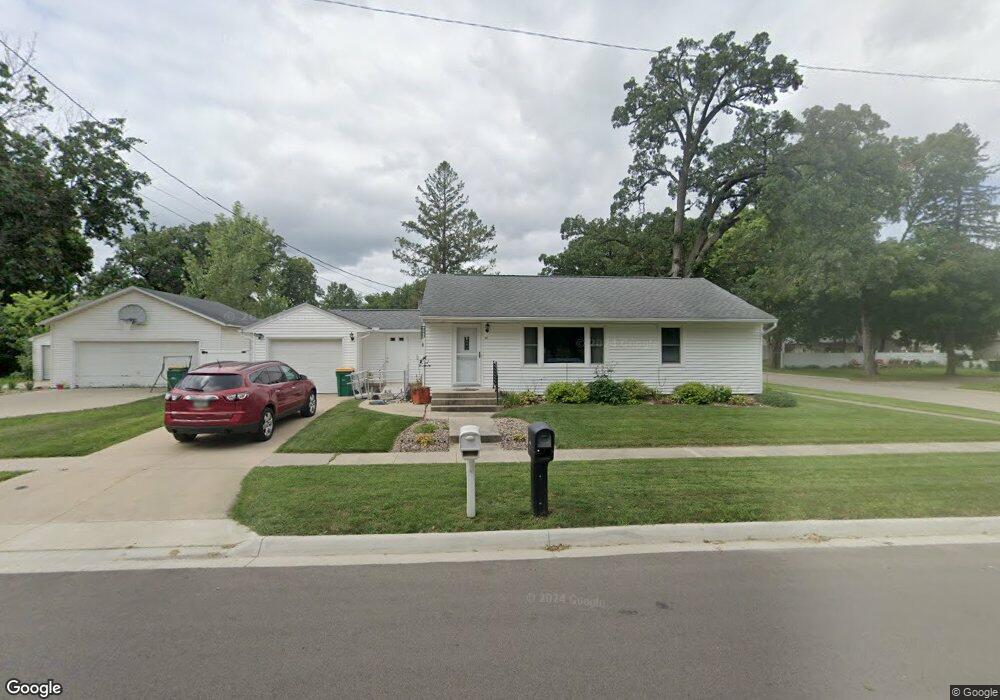
301 5th Ave SW Independence, IA 50644
Estimated Value: $168,000 - $176,437
3
Beds
2
Baths
1,596
Sq Ft
$109/Sq Ft
Est. Value
About This Home
This home is located at 301 5th Ave SW, Independence, IA 50644 and is currently estimated at $173,359, approximately $108 per square foot. 301 5th Ave SW is a home located in Buchanan County with nearby schools including West Elementary School, East Elementary School, and Independence Junior/Senior High School.
Ownership History
Date
Name
Owned For
Owner Type
Purchase Details
Closed on
Apr 27, 2012
Sold by
Post Justin S and Post Kelly L
Bought by
Luck Raymond C and Luck Judy M
Current Estimated Value
Home Financials for this Owner
Home Financials are based on the most recent Mortgage that was taken out on this home.
Original Mortgage
$30,000
Outstanding Balance
$20,795
Interest Rate
3.91%
Mortgage Type
New Conventional
Estimated Equity
$152,564
Create a Home Valuation Report for This Property
The Home Valuation Report is an in-depth analysis detailing your home's value as well as a comparison with similar homes in the area
Home Values in the Area
Average Home Value in this Area
Purchase History
| Date | Buyer | Sale Price | Title Company |
|---|---|---|---|
| Luck Raymond C | $115,000 | None Available |
Source: Public Records
Mortgage History
| Date | Status | Borrower | Loan Amount |
|---|---|---|---|
| Open | Luck Raymond C | $30,000 |
Source: Public Records
Tax History Compared to Growth
Tax History
| Year | Tax Paid | Tax Assessment Tax Assessment Total Assessment is a certain percentage of the fair market value that is determined by local assessors to be the total taxable value of land and additions on the property. | Land | Improvement |
|---|---|---|---|---|
| 2025 | $2,196 | $164,400 | $20,830 | $143,570 |
| 2024 | $2,196 | $141,980 | $18,600 | $123,380 |
| 2023 | $2,252 | $141,980 | $18,600 | $123,380 |
| 2022 | $2,122 | $113,190 | $14,760 | $98,430 |
| 2021 | $2,110 | $113,190 | $14,760 | $98,430 |
| 2020 | $2,110 | $104,680 | $13,530 | $91,150 |
| 2019 | $2,096 | $104,680 | $13,530 | $91,150 |
| 2018 | $2,002 | $102,770 | $13,530 | $89,240 |
| 2017 | $1,758 | $102,770 | $13,530 | $89,240 |
| 2016 | $1,726 | $90,370 | $7,320 | $83,050 |
| 2015 | $1,726 | $90,370 | $7,320 | $83,050 |
| 2014 | $1,762 | $90,370 | $7,320 | $83,050 |
Source: Public Records
Map
Nearby Homes