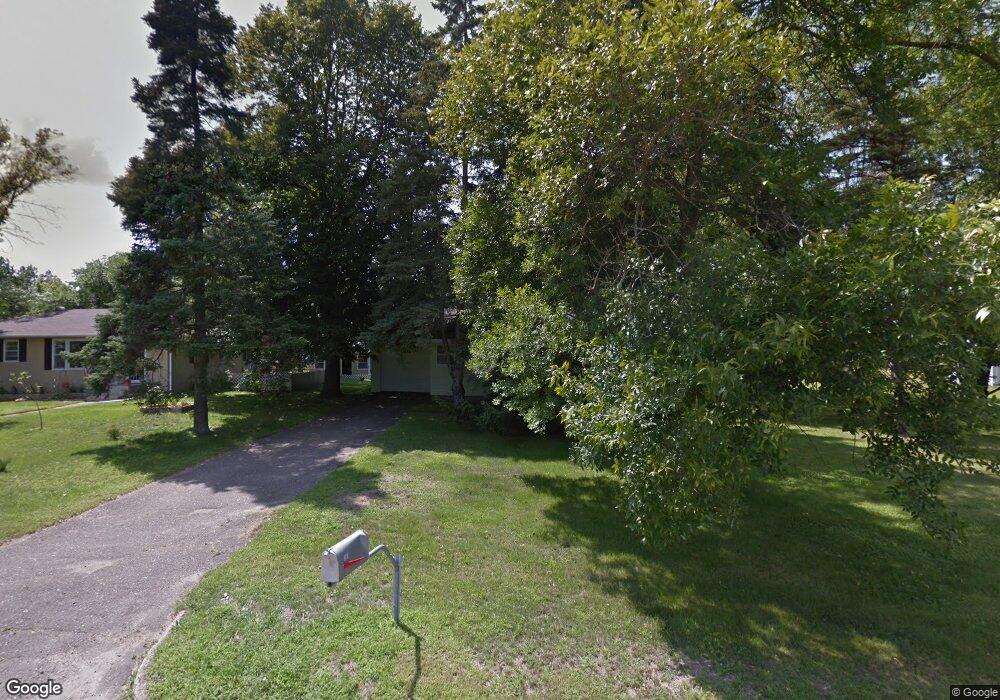
301 7th St NW Little Falls, MN 56345
Estimated Value: $185,759 - $200,000
3
Beds
2
Baths
976
Sq Ft
$196/Sq Ft
Est. Value
About This Home
This home is located at 301 7th St NW, Little Falls, MN 56345 and is currently estimated at $191,190, approximately $195 per square foot. 301 7th St NW is a home located in Morrison County with nearby schools including Little Falls Senior High School, Mary of Lourdes School, and Mary of Lourdes Elementary.
Ownership History
Date
Name
Owned For
Owner Type
Purchase Details
Closed on
Jul 29, 2016
Sold by
Vondelinde Dennis
Bought by
Silverness Richard A and Silverness Kristine M
Current Estimated Value
Purchase Details
Closed on
Oct 6, 2011
Sold by
Bank Of America Na
Bought by
Vondelinde Dennis
Home Financials for this Owner
Home Financials are based on the most recent Mortgage that was taken out on this home.
Original Mortgage
$42,300
Interest Rate
4.09%
Mortgage Type
New Conventional
Purchase Details
Closed on
Jul 13, 2010
Sold by
Karnes Shawn P and Storkamp Angelina M
Bought by
Bac Home Loans Servicing Lp
Create a Home Valuation Report for This Property
The Home Valuation Report is an in-depth analysis detailing your home's value as well as a comparison with similar homes in the area
Home Values in the Area
Average Home Value in this Area
Purchase History
| Date | Buyer | Sale Price | Title Company |
|---|---|---|---|
| Silverness Richard A | $109,900 | None Available | |
| Vondelinde Dennis | $47,000 | Multiple | |
| Bac Home Loans Servicing Lp | $109,547 | None Available |
Source: Public Records
Mortgage History
| Date | Status | Borrower | Loan Amount |
|---|---|---|---|
| Previous Owner | Vondelinde Dennis | $42,300 |
Source: Public Records
Tax History Compared to Growth
Tax History
| Year | Tax Paid | Tax Assessment Tax Assessment Total Assessment is a certain percentage of the fair market value that is determined by local assessors to be the total taxable value of land and additions on the property. | Land | Improvement |
|---|---|---|---|---|
| 2025 | $1,556 | $146,000 | $16,000 | $130,000 |
| 2024 | $1,570 | $141,200 | $16,000 | $125,200 |
| 2023 | $1,360 | $136,900 | $14,000 | $122,900 |
| 2022 | $1,108 | $117,600 | $14,000 | $103,600 |
| 2021 | $1,158 | $98,500 | $13,200 | $85,300 |
| 2020 | $1,042 | $276,300 | $39,600 | $236,700 |
| 2019 | $1,020 | $90,800 | $13,200 | $77,600 |
| 2018 | $954 | $85,300 | $13,200 | $72,100 |
| 2017 | $874 | $81,300 | $13,200 | $68,100 |
| 2016 | $832 | $0 | $0 | $0 |
| 2014 | $1,270 | $0 | $0 | $0 |
| 2013 | $1,270 | $0 | $0 | $0 |
Source: Public Records
Map
Nearby Homes