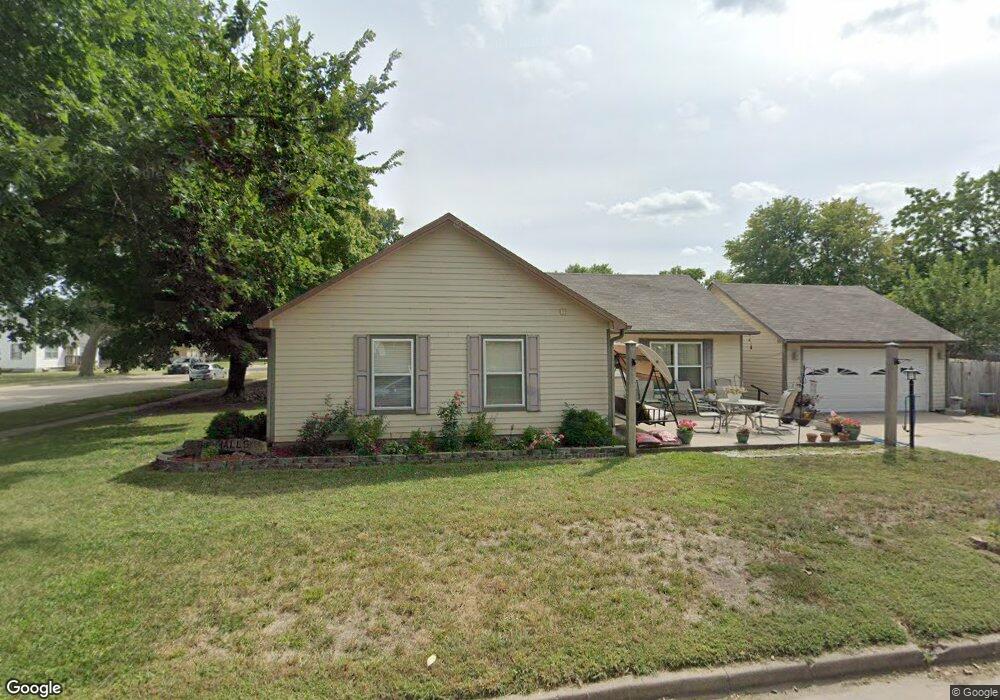
301 7th St Wamego, KS 66547
Estimated Value: $158,000 - $222,000
4
Beds
2
Baths
1,296
Sq Ft
$153/Sq Ft
Est. Value
About This Home
This home is located at 301 7th St, Wamego, KS 66547 and is currently estimated at $198,178, approximately $152 per square foot. 301 7th St is a home located in Pottawatomie County with nearby schools including Central Elementary School, West Elementary School, and Wamego Middle School.
Ownership History
Date
Name
Owned For
Owner Type
Purchase Details
Closed on
Oct 9, 2006
Sold by
Maberry Jeanne A
Bought by
Hall Donna R
Current Estimated Value
Home Financials for this Owner
Home Financials are based on the most recent Mortgage that was taken out on this home.
Original Mortgage
$143,300
Outstanding Balance
$85,084
Interest Rate
6.37%
Estimated Equity
$113,094
Purchase Details
Closed on
Jan 18, 2005
Sold by
Austin Nicholas A and Austin Adriane N
Bought by
Maberry Jeanne A
Home Financials for this Owner
Home Financials are based on the most recent Mortgage that was taken out on this home.
Original Mortgage
$95,600
Interest Rate
5.82%
Create a Home Valuation Report for This Property
The Home Valuation Report is an in-depth analysis detailing your home's value as well as a comparison with similar homes in the area
Home Values in the Area
Average Home Value in this Area
Purchase History
| Date | Buyer | Sale Price | Title Company |
|---|---|---|---|
| Hall Donna R | -- | None Available | |
| Maberry Jeanne A | -- | None Available |
Source: Public Records
Mortgage History
| Date | Status | Borrower | Loan Amount |
|---|---|---|---|
| Open | Hall Donna R | $143,300 | |
| Previous Owner | Maberry Jeanne A | $95,600 |
Source: Public Records
Tax History Compared to Growth
Tax History
| Year | Tax Paid | Tax Assessment Tax Assessment Total Assessment is a certain percentage of the fair market value that is determined by local assessors to be the total taxable value of land and additions on the property. | Land | Improvement |
|---|---|---|---|---|
| 2025 | $2,808 | $23,507 | $1,459 | $22,048 |
| 2024 | $28 | $23,325 | $1,277 | $22,048 |
| 2023 | $2,784 | $22,225 | $1,234 | $20,991 |
| 2022 | $2,218 | $19,496 | $1,197 | $18,299 |
| 2021 | $2,218 | $18,051 | $1,197 | $16,854 |
| 2020 | $2,218 | $17,945 | $1,248 | $16,697 |
| 2019 | $2,184 | $17,616 | $1,248 | $16,368 |
| 2018 | $2,176 | $17,599 | $1,332 | $16,267 |
| 2017 | $2,105 | $17,020 | $1,332 | $15,688 |
| 2016 | $2,115 | $17,322 | $1,273 | $16,049 |
| 2015 | -- | $16,837 | $1,273 | $15,564 |
| 2014 | -- | $16,037 | $1,179 | $14,858 |
Source: Public Records
Map
Nearby Homes