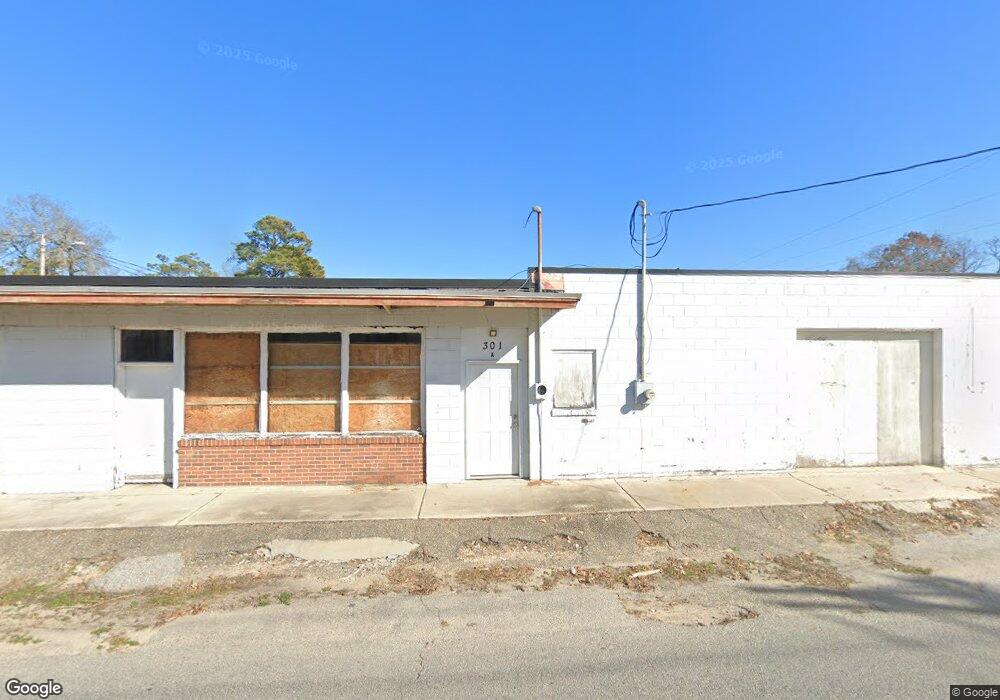
301 Broadway St Myrtle Beach, SC 29577
Downtown Myrtle Beach NeighborhoodEstimated Value: $192,890
--
Bed
--
Bath
4,000
Sq Ft
$48/Sq Ft
Est. Value
About This Home
This home is located at 301 Broadway St, Myrtle Beach, SC 29577 and is currently priced at $192,890, approximately $48 per square foot. 301 Broadway St is a home located in Horry County with nearby schools including Myrtle Beach Child Development Center, Myrtle Beach Primary School, and Myrtle Beach Elementary School.
Ownership History
Date
Name
Owned For
Owner Type
Purchase Details
Closed on
Aug 27, 2020
Sold by
Layton Lynn M
Bought by
Nitor Ventures Llc
Current Estimated Value
Purchase Details
Closed on
Aug 3, 2015
Bought by
Layton Lynn M
Purchase Details
Closed on
Aug 4, 2012
Sold by
Vereen Arthur Wayne
Bought by
Vereen Family Investments Llc
Purchase Details
Closed on
Aug 8, 2011
Sold by
Mcnatt Myra V
Bought by
Nealy Joyle M
Purchase Details
Closed on
Jul 1, 2011
Sold by
Vereen Leona O
Bought by
Abston Michael O
Purchase Details
Closed on
Jul 20, 2009
Sold by
Vereen Family Investments Llc
Bought by
Vereen Leona O
Purchase Details
Closed on
May 12, 2009
Sold by
Vereen Leona O
Bought by
Vereen Family Investments Llc
Purchase Details
Closed on
May 1, 2009
Sold by
Arthur B Vereen Credit Shelter Trust
Bought by
Vereen Family Investments Llc
Purchase Details
Closed on
Dec 3, 1999
Sold by
Vereen Leona O and Estate Of Arthur B Vereen
Bought by
Vereen Arthur Wayne and Perry Gail V
Create a Home Valuation Report for This Property
The Home Valuation Report is an in-depth analysis detailing your home's value as well as a comparison with similar homes in the area
Home Values in the Area
Average Home Value in this Area
Purchase History
| Date | Buyer | Sale Price | Title Company |
|---|---|---|---|
| Nitor Ventures Llc | $143,700 | -- | |
| Layton Lynn M | -- | -- | |
| Vereen Family Investments Llc | -- | -- | |
| Nealy Joyle M | -- | -- | |
| Abston Michael O | -- | -- | |
| Vereen Leona O | -- | -- | |
| Vereen Family Investments Llc | -- | -- | |
| Vereen Family Investments Llc | -- | -- | |
| Vereen Arthur Wayne | -- | -- |
Source: Public Records
Tax History Compared to Growth
Tax History
| Year | Tax Paid | Tax Assessment Tax Assessment Total Assessment is a certain percentage of the fair market value that is determined by local assessors to be the total taxable value of land and additions on the property. | Land | Improvement |
|---|---|---|---|---|
| 2024 | -- | $9,101 | $6,720 | $2,381 |
| 2023 | $0 | $8,352 | $3,360 | $4,992 |
| 2021 | $2,340 | $8,352 | $3,360 | $4,992 |
| 2020 | $1,603 | $6,216 | $3,360 | $2,856 |
| 2019 | $1,603 | $6,216 | $3,360 | $2,856 |
| 2018 | $0 | $6,948 | $5,280 | $1,668 |
| 2017 | $1,828 | $6,948 | $5,280 | $1,668 |
| 2016 | -- | $6,948 | $5,280 | $1,668 |
| 2015 | $1,807 | $6,948 | $5,280 | $1,668 |
| 2014 | $1,757 | $6,948 | $5,280 | $1,668 |
Source: Public Records
Map
Nearby Homes
- 904 3rd Ave N
- 506 Maple St Unit 508 Maple St.
- 602 3rd Ave N
- 603 Maple St
- 614 Collins St
- 0 3rd Ave S
- 1005 3rd Ave N Unit Multi-family lot
- 2310 Seaseeker Ln
- 2308 Seaseeker Ln
- 2312 Seaseeker Ln Unit Lot 11
- 2312 Seaseeker Ln
- 503 7th Ave N
- 1410 Lancaster Way Unit Lot 198, Ph. 2A, "Ea
- 315 Chapman Place
- 303 Withers Swash Dr
- 1009 3rd Ave N
- 50 S Kings Hwy Unit Z-50
- 404 2nd Ave N
- 311 3rd Ave N
- 708 Charlotte Rd
- 307 Broadway St Unit Hwy 15
- 303 Broadway St
- 802 3rd Ave N
- 315 Broadway St
- 302 Alder St Unit A
- 302 Alder St Unit D
- 302 Alder St
- 304 Alder St
- 306 Broadway St
- 210 Broadway St
- 306 Alder St
- 711 3rd Ave N
- 208 Broadway St
- 303 Alder St
- 305 Alder St
- 305A Maple St
- 307 Maple St
- 103 Broadway St Unit Todd Acres- MB
- 103 Broadway St Unit MB
- 707 3rd Ave N