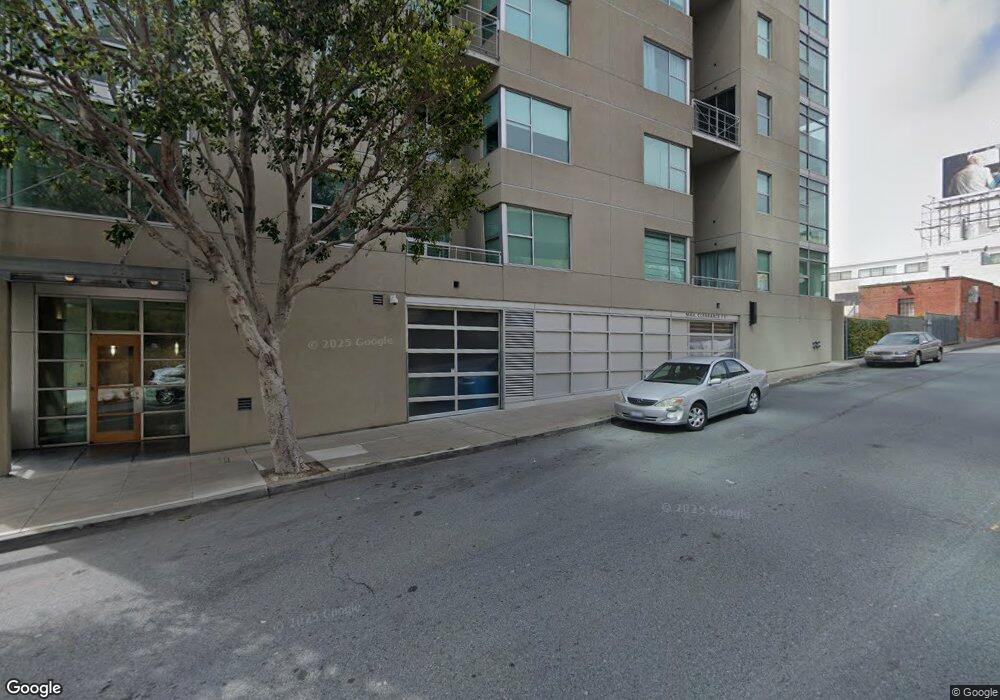
301 Bryant St Unit 503 San Francisco, CA 94107
South Beach NeighborhoodEstimated Value: $1,294,000 - $2,100,000
2
Beds
2
Baths
1,384
Sq Ft
$1,122/Sq Ft
Est. Value
About This Home
This home is located at 301 Bryant St Unit 503, San Francisco, CA 94107 and is currently estimated at $1,553,348, approximately $1,122 per square foot. 301 Bryant St Unit 503 is a home located in San Francisco County with nearby schools including Daniel Webster Elementary School, James Lick Middle School, and Five Keys Charter School.
Ownership History
Date
Name
Owned For
Owner Type
Purchase Details
Closed on
Jul 1, 2004
Sold by
Malin James W and Malin Janice B
Bought by
Bushnell Roderick and Bushnell Suzanne
Current Estimated Value
Home Financials for this Owner
Home Financials are based on the most recent Mortgage that was taken out on this home.
Original Mortgage
$500,000
Outstanding Balance
$234,614
Interest Rate
5.3%
Mortgage Type
Purchase Money Mortgage
Estimated Equity
$1,318,734
Purchase Details
Closed on
Jan 3, 2001
Sold by
Goelz Phillip C and Christensen Beth A
Bought by
Malin James W and Malin Janice B
Home Financials for this Owner
Home Financials are based on the most recent Mortgage that was taken out on this home.
Original Mortgage
$600,000
Interest Rate
6.75%
Purchase Details
Closed on
Sep 9, 1998
Sold by
Rincon Point Development Company Llc
Bought by
Goelz Phillip C and Christensen Beth A
Home Financials for this Owner
Home Financials are based on the most recent Mortgage that was taken out on this home.
Original Mortgage
$478,100
Interest Rate
6.79%
Create a Home Valuation Report for This Property
The Home Valuation Report is an in-depth analysis detailing your home's value as well as a comparison with similar homes in the area
Home Values in the Area
Average Home Value in this Area
Purchase History
| Date | Buyer | Sale Price | Title Company |
|---|---|---|---|
| Bushnell Roderick | $959,000 | Chicago Title Company | |
| Malin James W | $962,500 | First American Title Co | |
| Goelz Phillip C | $598,000 | Old Republic Title Company |
Source: Public Records
Mortgage History
| Date | Status | Borrower | Loan Amount |
|---|---|---|---|
| Open | Bushnell Roderick | $500,000 | |
| Previous Owner | Malin James W | $600,000 | |
| Previous Owner | Goelz Phillip C | $478,100 |
Source: Public Records
Tax History Compared to Growth
Tax History
| Year | Tax Paid | Tax Assessment Tax Assessment Total Assessment is a certain percentage of the fair market value that is determined by local assessors to be the total taxable value of land and additions on the property. | Land | Improvement |
|---|---|---|---|---|
| 2025 | $15,410 | $1,336,720 | $668,360 | $668,360 |
| 2024 | $15,410 | $1,310,512 | $655,256 | $655,256 |
| 2023 | $15,176 | $1,284,816 | $642,408 | $642,408 |
| 2022 | $14,903 | $1,259,624 | $629,812 | $629,812 |
| 2021 | $14,645 | $1,234,928 | $617,464 | $617,464 |
| 2020 | $14,690 | $1,222,268 | $611,134 | $611,134 |
| 2019 | $14,184 | $1,198,304 | $599,152 | $599,152 |
| 2018 | $13,707 | $1,174,808 | $587,404 | $587,404 |
| 2017 | $13,545 | $1,151,776 | $575,888 | $575,888 |
| 2016 | $13,326 | $1,129,196 | $564,598 | $564,598 |
| 2015 | $13,164 | $1,112,236 | $556,118 | $556,118 |
| 2014 | $12,816 | $1,090,452 | $545,226 | $545,226 |
Source: Public Records
Map
Nearby Homes
- 301 Bryant St Unit 601
- 1 Federal St Unit 12
- 200 Brannan St Unit 208
- 401 Harrison St Unit 44A
- 401 Harrison St Unit 6C
- 401 Harrison St Unit 31D
- 401 Harrison St Unit 46B
- 229 Brannan St Unit 12C
- 229 Brannan St Unit 15A
- 229 Brannan St Unit 2C
- 425 1st St Unit 1307
- 425 1st St Unit 2007
- 425 1st St Unit 1207
- 425 1st St Unit 3706
- 461 2nd St Unit 461T
- 461 2nd St Unit 558T
- 461 2nd St Unit 302C
- 219 Brannan St Unit 10H
- 219 Brannan St Unit 5G
- 219 Brannan St Unit 3G
- 301 Bryant St Unit 22D
- 301 Bryant St Unit 24D
- 301 Bryant St Unit D11
- 301 Bryant St
- 301 Bryant St Unit 702
- 301 Bryant St Unit D31
- 301 Bryant St Unit D11
- 301 Bryant St Unit 301
- 301 Bryant St Unit 504
- 301 Bryant St Unit 502
- 301 Bryant St Unit 403
- 301 Bryant St Unit 304
- 301 Bryant St Unit 303
- 301 Bryant St Unit 302
- 301 Bryant St Unit 202
- 301 Bryant St Unit 104
- 301 Bryant St Unit 103
- 301 Bryant St Unit D33
- 301 Bryant St Unit D25
- 301 Bryant St Unit 704