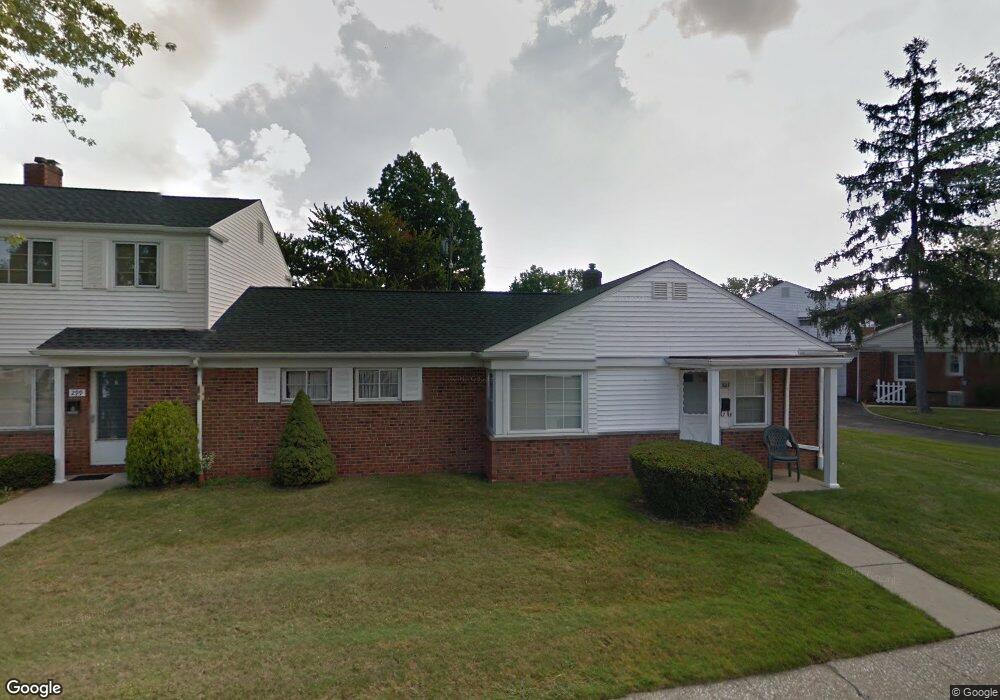
301 Buckner Dr Unit 168 Euclid, OH 44123
Estimated Value: $69,000 - $175,315
2
Beds
1
Bath
700
Sq Ft
$149/Sq Ft
Est. Value
About This Home
This home is located at 301 Buckner Dr Unit 168, Euclid, OH 44123 and is currently estimated at $104,579, approximately $149 per square foot. 301 Buckner Dr Unit 168 is a home located in Cuyahoga County with nearby schools including Bluestone Elementary School, Euclid High School, and Ss. Robert & William Catholic School.
Ownership History
Date
Name
Owned For
Owner Type
Purchase Details
Closed on
May 10, 2011
Sold by
Marko Joseph J and Schuster Susan M
Bought by
Vaccarino Frances A
Current Estimated Value
Home Financials for this Owner
Home Financials are based on the most recent Mortgage that was taken out on this home.
Original Mortgage
$15,000
Outstanding Balance
$10,386
Interest Rate
4.8%
Mortgage Type
New Conventional
Estimated Equity
$94,193
Purchase Details
Closed on
Jul 22, 1996
Sold by
Faiken Ronald E
Bought by
Marko Joseph and Marko Catherine M
Purchase Details
Closed on
Jan 1, 1978
Bought by
Faiken Ronald E
Create a Home Valuation Report for This Property
The Home Valuation Report is an in-depth analysis detailing your home's value as well as a comparison with similar homes in the area
Home Values in the Area
Average Home Value in this Area
Purchase History
| Date | Buyer | Sale Price | Title Company |
|---|---|---|---|
| Vaccarino Frances A | $25,000 | Enterprise Title Agency | |
| Marko Joseph | $45,000 | -- | |
| Faiken Ronald E | -- | -- |
Source: Public Records
Mortgage History
| Date | Status | Borrower | Loan Amount |
|---|---|---|---|
| Open | Vaccarino Frances A | $15,000 |
Source: Public Records
Tax History Compared to Growth
Tax History
| Year | Tax Paid | Tax Assessment Tax Assessment Total Assessment is a certain percentage of the fair market value that is determined by local assessors to be the total taxable value of land and additions on the property. | Land | Improvement |
|---|---|---|---|---|
| 2024 | $704 | $18,340 | $1,820 | $16,520 |
| 2023 | $298 | $11,000 | $1,090 | $9,910 |
| 2022 | $328 | $10,990 | $1,090 | $9,910 |
| 2021 | $345 | $10,990 | $1,090 | $9,910 |
| 2020 | $145 | $7,810 | $770 | $7,040 |
| 2019 | $121 | $22,300 | $2,200 | $20,100 |
| 2018 | $116 | $7,810 | $770 | $7,040 |
| 2017 | $116 | $4,380 | $1,020 | $3,360 |
| 2016 | $116 | $4,380 | $1,020 | $3,360 |
| 2015 | $122 | $4,380 | $1,020 | $3,360 |
| 2014 | $122 | $8,760 | $2,000 | $6,760 |
Source: Public Records
Map
Nearby Homes
- 303 E 235th St
- 323 E 235th St
- 324 E 235th St
- 315 E 232nd St
- 334 E 238th St
- 244 E 238th St
- 305 E 238th St
- 23337 Williams Ave
- 254 E 242nd St
- 310 E 243rd St
- 71 Luikart Dr
- 321 E 243rd St
- 23198 Gay St
- 368 E 248th St
- 24850 Shoreview Ave
- 24850 Zeman Ave
- 24891 Zeman Ave
- 225 E 246th St
- 23896 Devoe Ave
- 24451 Devoe Ave
- 295 Buckner Dr Unit 165
- 297 Buckner Dr Unit 166
- 299 Buckner Dr
- 295 Buckner Dr Unit 1
- 301 Buckner Dr Unit 1
- 298 E 235th St
- 298 E 235th St Unit 178
- 293 Buckner Dr Unit 164
- 291 Buckner Dr
- 291 Buckner Dr Unit 163
- 292 E 235th St Unit 181
- 294 E 235th St Unit 180
- 296 E 235th St Unit 179
- 294 E 235th St Unit 1
- 315 Buckner Dr Unit 170
- 319 Buckner Dr
- 313 Buckner Dr Unit 169
- 317 Buckner Dr
- 319 Buckner Dr Unit 172
- 317 Buckner Dr Unit 171