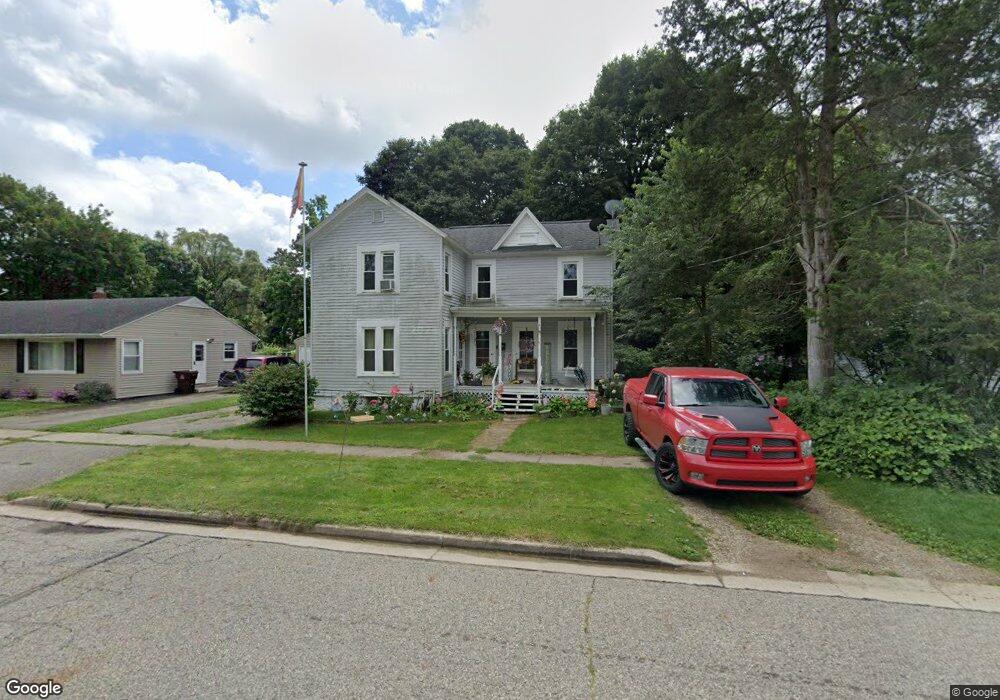
301 Crary St Marshall, MI 49068
Estimated Value: $168,143 - $239,000
4
Beds
2
Baths
1,500
Sq Ft
$132/Sq Ft
Est. Value
About This Home
This home is located at 301 Crary St, Marshall, MI 49068 and is currently estimated at $197,786, approximately $131 per square foot. 301 Crary St is a home located in Calhoun County with nearby schools including Harrington Elementary School, Marshall High School, and Marshall Academy.
Ownership History
Date
Name
Owned For
Owner Type
Purchase Details
Closed on
Dec 13, 2023
Sold by
Jc Kimball Properties Llc
Bought by
Smith Heather and Smith Ryan
Current Estimated Value
Home Financials for this Owner
Home Financials are based on the most recent Mortgage that was taken out on this home.
Original Mortgage
$125,337
Outstanding Balance
$120,274
Interest Rate
7.5%
Mortgage Type
FHA
Estimated Equity
$77,512
Purchase Details
Closed on
Jan 24, 2020
Sold by
Kimball Joseph W and Kimball Carol A
Bought by
Jc Kimball Properties Llc
Purchase Details
Closed on
Sep 3, 2009
Sold by
Root William C and Root Vickie L
Bought by
Quadrant Residential Capital Ii Llc
Purchase Details
Closed on
Nov 20, 1995
Sold by
Fitch Donald F and Fitch Betty
Bought by
Root William C and Root Vickie L
Purchase Details
Closed on
Jan 1, 1989
Create a Home Valuation Report for This Property
The Home Valuation Report is an in-depth analysis detailing your home's value as well as a comparison with similar homes in the area
Home Values in the Area
Average Home Value in this Area
Purchase History
| Date | Buyer | Sale Price | Title Company |
|---|---|---|---|
| Smith Heather | $127,650 | None Listed On Document | |
| Smith Heather | $127,650 | None Listed On Document | |
| Jc Kimball Properties Llc | -- | None Available | |
| Quadrant Residential Capital Ii Llc | -- | None Available | |
| Root William C | $44,000 | -- | |
| -- | $30,000 | -- |
Source: Public Records
Mortgage History
| Date | Status | Borrower | Loan Amount |
|---|---|---|---|
| Open | Smith Heather | $125,337 | |
| Closed | Smith Heather | $125,337 |
Source: Public Records
Tax History
| Year | Tax Paid | Tax Assessment Tax Assessment Total Assessment is a certain percentage of the fair market value that is determined by local assessors to be the total taxable value of land and additions on the property. | Land | Improvement |
|---|---|---|---|---|
| 2025 | $4,055 | $78,500 | $0 | $0 |
| 2024 | $788 | $72,800 | $0 | $0 |
| 2023 | $2,675 | $70,400 | $0 | $0 |
| 2022 | $1,942 | $60,400 | $0 | $0 |
| 2021 | $2,597 | $60,000 | $0 | $0 |
| 2020 | $2,484 | $51,300 | $0 | $0 |
| 2019 | $0 | $39,000 | $0 | $0 |
| 2018 | $0 | $38,600 | $11,400 | $27,200 |
| 2017 | $0 | $36,000 | $0 | $0 |
| 2016 | $0 | $35,900 | $0 | $0 |
| 2015 | -- | $32,500 | $0 | $0 |
| 2014 | -- | $31,900 | $0 | $0 |
Source: Public Records
Map
Nearby Homes
- 1025 Rebecca St Unit 15
- 1029 Rebecca St Unit 13
- 1049 Rebecca St Unit 3
- 130 W Hughes St
- 1026 Rose St
- 1027 Rebecca St Unit 14
- 1048 S Kalamazoo Ave
- 1043 Rose St
- 1060 S Kalamazoo Ave
- 1050 Rebecca St Unit 18
- 340 S Eagle St
- 112 W Spruce St
- 103 Hart St
- 107 Hart St
- 126 W Hanover St
- 519 E Spruce St
- 109 S Mulberry St
- 206 Exchange St
- 217 S Marshall Ave
- 210 N Kalamazoo Ave
Your Personal Tour Guide
Ask me questions while you tour the home.