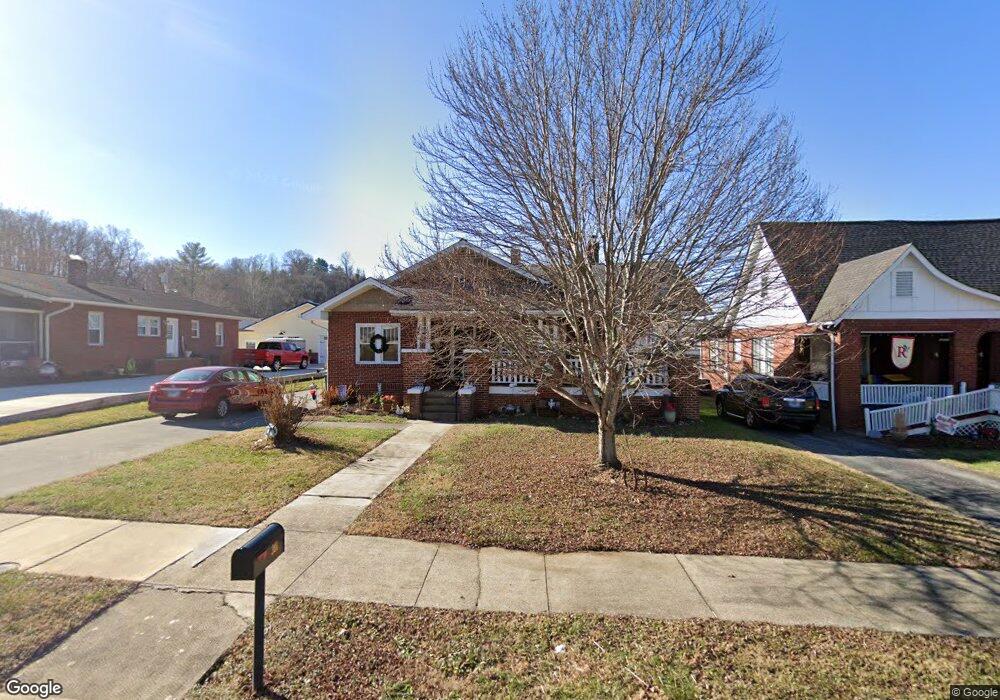
301 Daytona Place Elizabethton, TN 37643
Estimated Value: $248,000 - $301,000
--
Bed
2
Baths
1,616
Sq Ft
$171/Sq Ft
Est. Value
About This Home
This home is located at 301 Daytona Place, Elizabethton, TN 37643 and is currently estimated at $276,189, approximately $170 per square foot. 301 Daytona Place is a home located in Carter County with nearby schools including Elizabethton High School and East Tn Christian Home & Academy.
Ownership History
Date
Name
Owned For
Owner Type
Purchase Details
Closed on
Jun 13, 2011
Sold by
Isakson Charles Stark
Bought by
Laughters Kathy
Current Estimated Value
Home Financials for this Owner
Home Financials are based on the most recent Mortgage that was taken out on this home.
Original Mortgage
$115,940
Outstanding Balance
$80,238
Interest Rate
4.79%
Mortgage Type
VA
Estimated Equity
$195,951
Purchase Details
Closed on
May 19, 2011
Sold by
Odom Charles Thomas
Bought by
Isakson Charles Stark
Home Financials for this Owner
Home Financials are based on the most recent Mortgage that was taken out on this home.
Original Mortgage
$115,940
Outstanding Balance
$80,238
Interest Rate
4.79%
Mortgage Type
VA
Estimated Equity
$195,951
Purchase Details
Closed on
Sep 3, 2004
Sold by
John Hathaway
Bought by
Odom Shane Leann Etvir
Purchase Details
Closed on
Feb 15, 1973
Bought by
Hathaway John Lusk and Helen Chmbe
Create a Home Valuation Report for This Property
The Home Valuation Report is an in-depth analysis detailing your home's value as well as a comparison with similar homes in the area
Home Values in the Area
Average Home Value in this Area
Purchase History
| Date | Buyer | Sale Price | Title Company |
|---|---|---|---|
| Laughters Kathy | -- | -- | |
| Isakson Charles Stark | $113,500 | -- | |
| Odom Shane Leann Etvir | $83,500 | -- | |
| Hathaway John Lusk | -- | -- |
Source: Public Records
Mortgage History
| Date | Status | Borrower | Loan Amount |
|---|---|---|---|
| Open | Isakson Charles Stark | $115,940 |
Source: Public Records
Tax History Compared to Growth
Tax History
| Year | Tax Paid | Tax Assessment Tax Assessment Total Assessment is a certain percentage of the fair market value that is determined by local assessors to be the total taxable value of land and additions on the property. | Land | Improvement |
|---|---|---|---|---|
| 2024 | $1,294 | $39,200 | $7,100 | $32,100 |
| 2023 | $1,294 | $39,200 | $0 | $0 |
| 2022 | $1,360 | $37,775 | $7,100 | $30,675 |
| 2021 | $767 | $37,775 | $7,100 | $30,675 |
| 2020 | $1,102 | $37,775 | $7,100 | $30,675 |
| 2019 | $1,102 | $25,500 | $3,700 | $21,800 |
| 2018 | $1,086 | $25,500 | $3,700 | $21,800 |
| 2017 | $1,086 | $25,500 | $3,700 | $21,800 |
| 2016 | $1,081 | $25,500 | $3,700 | $21,800 |
| 2015 | $1,084 | $25,500 | $3,700 | $21,800 |
| 2014 | $1,055 | $24,700 | $3,700 | $21,000 |
Source: Public Records
Map
Nearby Homes
- 404 Allen Ave
- 304 Ridgecrest Dr
- 201 Ridgecrest Dr
- 115 W F St
- 621 Mcarthur Ave
- 229 W Doe Ave
- 511 S Watauga Ave
- 116 E G St
- 112 S Watauga Ave
- 304 E H St
- 612 S Lynn Ave
- 722 S Watauga Ave
- 398 River Island Ln
- 705 Holston Ave
- TBD Tennessee 91
- 210 E Cottage Ave
- 604 Parkway Blvd
- 503 Florence St
- 309 Elm St
- 700 W Riverside Dr
- 217 Daytona Place
- 303 Daytona Place
- 215 Daytona Place
- 00 Daytona Place
- TBD Daytona Place
- 306 Ferguson Ave
- 305 Daytona Place
- 304 Ferguson Ave
- 400 Ferguson Ave
- 211 Daytona Place
- 300 Daytona Place
- 402 Ferguson Ave
- 302 Daytona Place
- 216 Ferguson Ave
- 309 Daytona Place
- 216 Daytona Place
- 216 Daytona Place
- 209 Daytona Place
- 304 Daytona Place
- TBD Ferguson Ave