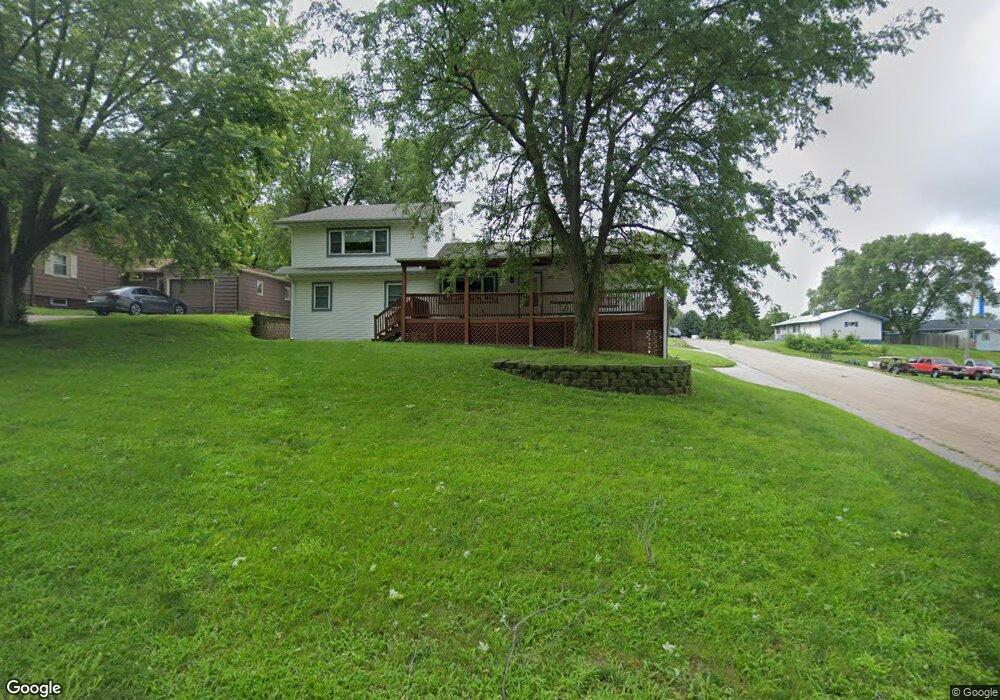
301 E Elm St Bloomfield, NE 68718
Estimated Value: $102,000 - $180,228
Studio
2
Baths
1,824
Sq Ft
$77/Sq Ft
Est. Value
About This Home
This home is located at 301 E Elm St, Bloomfield, NE 68718 and is currently estimated at $141,057, approximately $77 per square foot. 301 E Elm St is a home located in Knox County with nearby schools including Bloomfield Elementary School and Bloomfield Junior/Senior High School.
Ownership History
Date
Name
Owned For
Owner Type
Purchase Details
Closed on
Feb 18, 2022
Sold by
Sazama Renee J
Bought by
Sazama Renee J and Downie David G
Current Estimated Value
Purchase Details
Closed on
Jun 5, 2008
Sold by
Mccardle Jena S and Miller Jena S
Bought by
Mccardle Jena S
Purchase Details
Closed on
Jul 1, 2000
Create a Home Valuation Report for This Property
The Home Valuation Report is an in-depth analysis detailing your home's value as well as a comparison with similar homes in the area
Purchase History
| Date | Buyer | Sale Price | Title Company |
|---|---|---|---|
| Sazama Renee J | -- | None Listed On Document | |
| Mccardle Jena S | -- | -- | |
| Miller Jena S | -- | -- | |
| -- | $24,000 | -- |
Source: Public Records
Tax History
| Year | Tax Paid | Tax Assessment Tax Assessment Total Assessment is a certain percentage of the fair market value that is determined by local assessors to be the total taxable value of land and additions on the property. | Land | Improvement |
|---|---|---|---|---|
| 2025 | $1,729 | $148,740 | $14,180 | $134,560 |
| 2024 | $1,833 | $143,360 | $14,180 | $129,180 |
| 2023 | $1,833 | $127,445 | $14,180 | $113,265 |
| 2022 | $1,749 | $116,805 | $7,290 | $109,515 |
| 2021 | $1,697 | $111,975 | $7,290 | $104,685 |
| 2020 | $1,708 | $111,975 | $7,290 | $104,685 |
| 2019 | $1,762 | $111,975 | $7,290 | $104,685 |
| 2018 | $1,560 | $100,585 | $7,290 | $93,295 |
| 2017 | $1,568 | $98,900 | $5,605 | $93,295 |
| 2016 | $1,411 | $98,200 | $5,605 | $92,595 |
| 2015 | $1,389 | $92,090 | $4,040 | $88,050 |
| 2014 | $1,480 | $89,070 | $4,040 | $85,030 |
| 2013 | $1,328 | $76,145 | $4,040 | $72,105 |
Source: Public Records
Map
Nearby Homes
- 206 E Elm St
- 405 E Main St
- 502 W Main St
- 109 Jay St
- 200 E Roosevelt St
- 703 E Clark St
- 702 E Norris St
- 502 S Sherman St
- 708 E Grant St
- 88922 550th Ave
- 88952 550 Ave
- 609 W Omaha St
- 55310 Nebraska 121
- 312 Bazille St
- 1207 W 4th St
- 903 W 2nd St
- 315 W Colorado St
- 886 Rd Unit 532 Ave
- 55431 Highway 12
- See Legal Lot 303
Your Personal Tour Guide
Ask me questions while you tour the home.