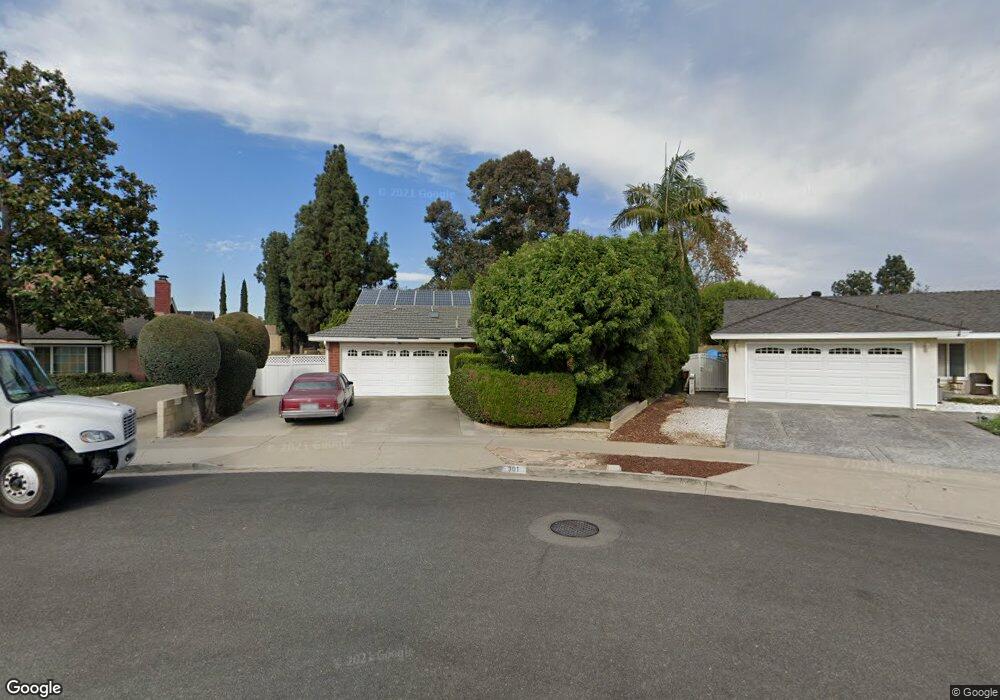
301 Fleming Ave Placentia, CA 92870
Estimated Value: $1,078,000 - $1,108,000
3
Beds
2
Baths
1,452
Sq Ft
$750/Sq Ft
Est. Value
About This Home
This home is located at 301 Fleming Ave, Placentia, CA 92870 and is currently estimated at $1,088,756, approximately $749 per square foot. 301 Fleming Ave is a home located in Orange County with nearby schools including Sierra Vista Elementary School, Col. J. K. Tuffree Middle School, and El Dorado High School.
Ownership History
Date
Name
Owned For
Owner Type
Purchase Details
Closed on
Aug 25, 2021
Sold by
Recker Jerome E and Recker Sylvia R
Bought by
Recker Jerome E and Recker Sylvia R
Current Estimated Value
Home Financials for this Owner
Home Financials are based on the most recent Mortgage that was taken out on this home.
Original Mortgage
$407,500
Interest Rate
2.8%
Mortgage Type
New Conventional
Purchase Details
Closed on
Jun 8, 2020
Sold by
Recker Jerome E and Recker Sylvia R
Bought by
Recker Jerome E and Recker Sylvia R
Home Financials for this Owner
Home Financials are based on the most recent Mortgage that was taken out on this home.
Original Mortgage
$411,000
Interest Rate
3.2%
Mortgage Type
New Conventional
Purchase Details
Closed on
Sep 29, 2018
Sold by
Recker Jerome E and Recker Sylvia R
Bought by
Recker Jerome E and Recker Sylvia R
Create a Home Valuation Report for This Property
The Home Valuation Report is an in-depth analysis detailing your home's value as well as a comparison with similar homes in the area
Home Values in the Area
Average Home Value in this Area
Purchase History
| Date | Buyer | Sale Price | Title Company |
|---|---|---|---|
| Recker Jerome E | -- | Accommodation | |
| Recker Jerome E | -- | Wfg National Title Co Of Ca | |
| Recker Jerome E | -- | Accommodation | |
| Recker Jerome E | -- | Wfg National Title Co Of Ca | |
| Recker Jerome E | -- | None Available |
Source: Public Records
Mortgage History
| Date | Status | Borrower | Loan Amount |
|---|---|---|---|
| Previous Owner | Recker Jerome E | $407,500 | |
| Previous Owner | Recker Jerome E | $411,000 |
Source: Public Records
Tax History
| Year | Tax Paid | Tax Assessment Tax Assessment Total Assessment is a certain percentage of the fair market value that is determined by local assessors to be the total taxable value of land and additions on the property. | Land | Improvement |
|---|---|---|---|---|
| 2025 | $3,443 | $253,570 | $110,333 | $143,237 |
| 2024 | $3,443 | $248,599 | $108,170 | $140,429 |
| 2023 | $3,349 | $243,725 | $106,049 | $137,676 |
| 2022 | $3,269 | $238,947 | $103,970 | $134,977 |
| 2021 | $3,164 | $234,262 | $101,931 | $132,331 |
| 2020 | $3,172 | $231,860 | $100,885 | $130,975 |
| 2019 | $3,036 | $227,314 | $98,907 | $128,407 |
| 2018 | $2,993 | $222,857 | $96,967 | $125,890 |
| 2017 | $2,939 | $218,488 | $95,066 | $123,422 |
| 2016 | $2,880 | $214,204 | $93,202 | $121,002 |
| 2015 | $2,839 | $210,987 | $91,802 | $119,185 |
| 2014 | $2,763 | $206,855 | $90,004 | $116,851 |
Source: Public Records
Map
Nearby Homes
- 2454 Beacon St
- 237 Bagnall Ave
- 1714 Sierra Bonita Dr
- 2531 Hartford Ave
- 206 Allegheny Cir
- 320 Purdy Ave
- 3016 Clearwood Ct
- 1714 Kingston Rd
- 2541 Thorn Place
- 1719 Pecos River
- 213 Appalachian Cir
- 3110 E Palm Dr Unit 14
- 455 Purdy Ave
- 2851 Rolling Hills Dr Unit 257
- 2851 Rolling Hills Dr Unit 248
- 2851 Rolling Hills Dr
- 230 Gila Way
- 1837 Kelleher Place
- 2760 Quail Ridge Cir Unit 57
- 2733 Quail Ridge Cir Unit 32
- 2042 Frederick St
- 307 Fleming Ave
- 2100 Fremont Ave
- 2049 Tuffree Blvd
- 2036 Frederick St
- 2043 Tuffree Blvd
- 313 Fleming Ave
- 2106 Fremont Ave
- 2037 Tuffree Blvd
- 306 Fleming Ave
- 2030 Frederick St
- 319 Fleming Ave
- 2112 Fremont Ave
- 312 Fleming Ave
- 2031 Tuffree Blvd
- 2024 Frederick St
- 307 Carolina Way
- 2044 Tuffree Blvd
- 318 Fleming Ave
- 2118 Fremont Ave
Your Personal Tour Guide
Ask me questions while you tour the home.