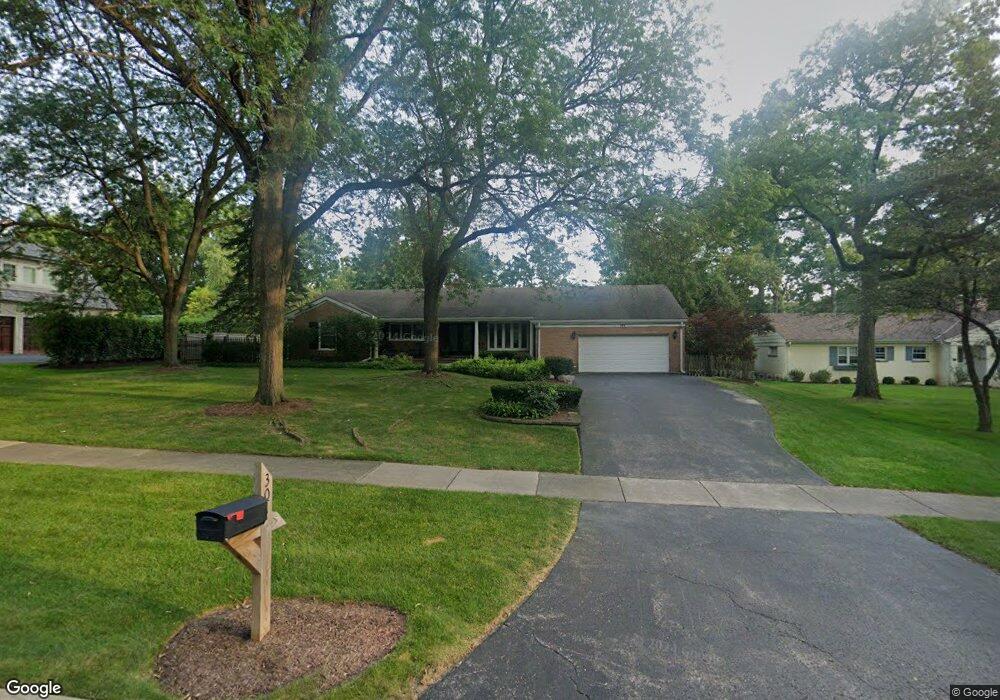
301 Glenwood Rd Lake Forest, IL 60045
Estimated Value: $880,506 - $1,021,000
3
Beds
3
Baths
2,264
Sq Ft
$422/Sq Ft
Est. Value
About This Home
This home is located at 301 Glenwood Rd, Lake Forest, IL 60045 and is currently estimated at $954,377, approximately $421 per square foot. 301 Glenwood Rd is a home located in Lake County with nearby schools including Cherokee Elementary School, Deer Path Middle School East, and Lake Forest High School.
Ownership History
Date
Name
Owned For
Owner Type
Purchase Details
Closed on
Oct 6, 2022
Sold by
Ott John J and Ott Renee S
Bought by
Renee S Ott Trust
Current Estimated Value
Purchase Details
Closed on
Sep 4, 2018
Sold by
Ott John J
Bought by
Ott John J and Ott Renee O
Purchase Details
Closed on
Feb 2, 2009
Sold by
Ott John J and Ott Renee S
Bought by
Ott John J and John J Ott Jr Trust
Purchase Details
Closed on
Jun 3, 2003
Sold by
Aiossa Frederick and Aiossa Virginia
Bought by
Ott John J and Ott Renee S
Home Financials for this Owner
Home Financials are based on the most recent Mortgage that was taken out on this home.
Original Mortgage
$200,000
Interest Rate
6.01%
Mortgage Type
Unknown
Purchase Details
Closed on
May 4, 1999
Sold by
Bowers Ralph E and Bowers Roberta F
Bought by
Aiossa Frederick and Aiossa Virginia
Home Financials for this Owner
Home Financials are based on the most recent Mortgage that was taken out on this home.
Original Mortgage
$215,000
Interest Rate
6.99%
Create a Home Valuation Report for This Property
The Home Valuation Report is an in-depth analysis detailing your home's value as well as a comparison with similar homes in the area
Home Values in the Area
Average Home Value in this Area
Purchase History
| Date | Buyer | Sale Price | Title Company |
|---|---|---|---|
| Renee S Ott Trust | -- | -- | |
| Ott John J | -- | None Available | |
| Ott John J | -- | None Available | |
| Ott John J | $672,500 | Ticor Title Insurance Compan | |
| Aiossa Frederick | $405,000 | -- |
Source: Public Records
Mortgage History
| Date | Status | Borrower | Loan Amount |
|---|---|---|---|
| Previous Owner | Ott John J | $200,000 | |
| Previous Owner | Aiossa Frederick | $215,000 |
Source: Public Records
Tax History Compared to Growth
Tax History
| Year | Tax Paid | Tax Assessment Tax Assessment Total Assessment is a certain percentage of the fair market value that is determined by local assessors to be the total taxable value of land and additions on the property. | Land | Improvement |
|---|---|---|---|---|
| 2024 | $12,139 | $218,615 | $108,447 | $110,168 |
| 2023 | $10,671 | $209,803 | $104,076 | $105,727 |
| 2022 | $10,671 | $188,510 | $107,529 | $80,981 |
| 2021 | $10,663 | $191,783 | $103,672 | $88,111 |
| 2020 | $10,387 | $192,186 | $103,890 | $88,296 |
| 2019 | $10,805 | $205,594 | $103,714 | $101,880 |
| 2018 | $9,222 | $184,927 | $109,930 | $74,997 |
| 2017 | $9,261 | $184,337 | $109,579 | $74,758 |
| 2016 | $8,971 | $177,366 | $105,435 | $71,931 |
| 2015 | $8,821 | $181,388 | $99,065 | $82,323 |
| 2014 | $8,761 | $181,726 | $99,773 | $81,953 |
| 2012 | $9,211 | $180,123 | $98,893 | $81,230 |
Source: Public Records
Map
Nearby Homes
- 104 E Louis Ave
- 710 Buena Rd
- 1010 S Green Bay Rd
- 51 Heron Rd
- 390 S Basswood Rd
- 510 Buena Rd
- 262 E Foster Place
- 1124 Fairview Ave
- 1150 Highland Ave
- 261 E Onwentsia Rd
- 930 S Ridge Rd
- 3464 Old Mill Rd
- 27 W Onwentsia Rd
- 1022 Estes Ave
- 250 S Sheridan Rd
- 51 Sequoia Ct
- 912 Morningside Dr
- 687 W Old Elm Rd
- 24 Washington Cir
- 602 Old Elm Rd
- 289 Glenwood Rd
- 325 Glenwood Rd
- 312 Cherokee Rd
- 320 Cherokee Rd
- 290 Cherokee Rd
- 265 Glenwood Rd
- 300 Glenwood Rd
- 351 Glenwood Rd
- 314 Glenwood Rd
- 344 Cherokee Rd
- 286 Glenwood Rd
- 274 Cherokee Rd
- 334 Glenwood Rd
- 255 Glenwood Rd
- 365 Glenwood Rd
- 270 Glenwood Rd
- 350 Glenwood Rd
- 737 Waveland Rd
- 311 Cherokee Rd
- 250 Cherokee Rd