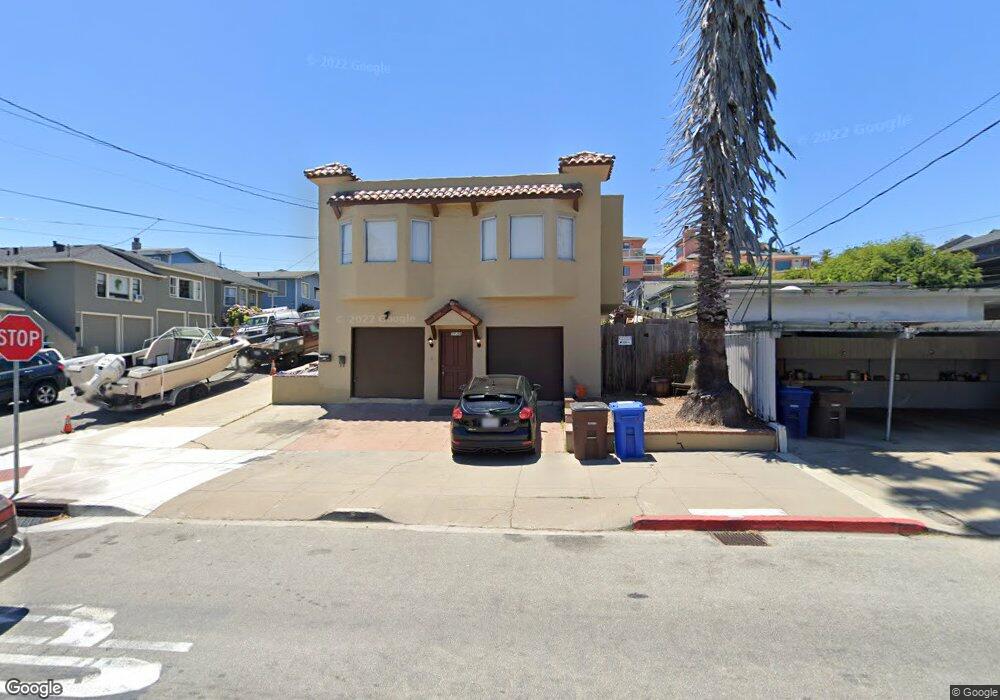
301 Hawthorne St Monterey, CA 93940
New Monterey NeighborhoodEstimated Value: $1,158,873 - $1,672,000
4
Beds
1
Bath
1,662
Sq Ft
$847/Sq Ft
Est. Value
About This Home
This home is located at 301 Hawthorne St, Monterey, CA 93940 and is currently estimated at $1,408,468, approximately $847 per square foot. 301 Hawthorne St is a home located in Monterey County with nearby schools including Monte Vista Elementary School, Monte Vista Middle School, and Monterey High School.
Ownership History
Date
Name
Owned For
Owner Type
Purchase Details
Closed on
Jun 10, 2025
Sold by
Pennisi Billie Elaine
Bought by
Billie Elaine Pennisi 2025 Trust and Pennisi
Current Estimated Value
Purchase Details
Closed on
May 1, 2017
Sold by
Pennisi Billie Elaine
Bought by
Pennisi Billie Elaine and Pennisi Marco
Purchase Details
Closed on
Dec 27, 2016
Sold by
Pennisi Billie Elaine and Pennisi Billie
Bought by
Pennisi Billie Elaine
Home Financials for this Owner
Home Financials are based on the most recent Mortgage that was taken out on this home.
Original Mortgage
$530,000
Interest Rate
3.94%
Mortgage Type
New Conventional
Purchase Details
Closed on
May 20, 2005
Sold by
Pennisi Giuseppi
Bought by
Pennisi Giuseppi and Pennisi Billie
Home Financials for this Owner
Home Financials are based on the most recent Mortgage that was taken out on this home.
Original Mortgage
$480,000
Interest Rate
5.84%
Mortgage Type
Fannie Mae Freddie Mac
Create a Home Valuation Report for This Property
The Home Valuation Report is an in-depth analysis detailing your home's value as well as a comparison with similar homes in the area
Home Values in the Area
Average Home Value in this Area
Purchase History
| Date | Buyer | Sale Price | Title Company |
|---|---|---|---|
| Billie Elaine Pennisi 2025 Trust | -- | None Listed On Document | |
| Pennisi Billie Elaine | -- | None Available | |
| Pennisi Billie Elaine | -- | Old Republic Title Company | |
| Pennisi Giuseppi | -- | Investors Title Company | |
| Pennisi Giuseppi | -- | Investors Title Company |
Source: Public Records
Mortgage History
| Date | Status | Borrower | Loan Amount |
|---|---|---|---|
| Previous Owner | Pennisi Billie Elaine | $530,000 | |
| Previous Owner | Pennisi Giuseppi | $480,000 |
Source: Public Records
Tax History
| Year | Tax Paid | Tax Assessment Tax Assessment Total Assessment is a certain percentage of the fair market value that is determined by local assessors to be the total taxable value of land and additions on the property. | Land | Improvement |
|---|---|---|---|---|
| 2025 | $1,447 | $100,408 | $38,901 | $61,507 |
| 2024 | $1,447 | $98,440 | $38,139 | $60,301 |
| 2023 | $1,151 | $96,511 | $37,392 | $59,119 |
| 2022 | $1,136 | $94,619 | $36,659 | $57,960 |
| 2021 | $1,120 | $92,765 | $35,941 | $56,824 |
| 2020 | $1,081 | $91,815 | $35,573 | $56,242 |
| 2019 | $4,461 | $383,138 | $238,523 | $144,615 |
| 2018 | $4,286 | $375,627 | $233,847 | $141,780 |
| 2017 | $1,013 | $86,521 | $33,522 | $52,999 |
| 2016 | $995 | $84,825 | $32,865 | $51,960 |
| 2015 | $1,289 | $83,552 | $32,372 | $51,180 |
| 2014 | $967 | $81,916 | $31,738 | $50,178 |
Source: Public Records
Map
Nearby Homes
- 321 Hawthorne St
- 345 Hawthorne St Unit 347
- 345 Hawthorne St
- 347 Hawthorne St
- 330 Laine St Unit Amazing views
- 360 Dickman Ave
- 371 Hawthorne St
- 300 Hawthorne St
- 280 Laine St
- 298 Hawthorne St
- 265 Hawthorne St
- 381 Hawthorne St
- 461 Drake Ave
- 272 Laine St
- 261 Hawthorne St
- 272 Hawthorne St
- 481 Drake Ave
- 399 Hawthorne St
- 499 Drake Ave
- 249 Hawthorne St
Your Personal Tour Guide
Ask me questions while you tour the home.