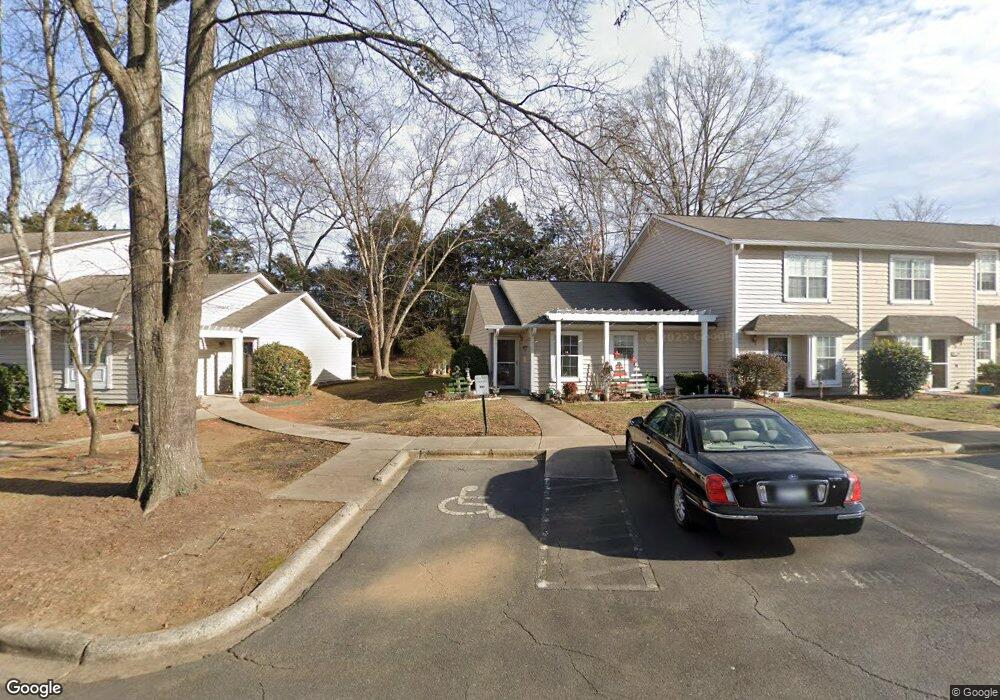
301 Heritage Pkwy Unit 301 Fort Mill, SC 29715
Springfield NeighborhoodEstimated Value: $140,000 - $266,000
--
Bed
--
Bath
728
Sq Ft
$270/Sq Ft
Est. Value
About This Home
This home is located at 301 Heritage Pkwy Unit 301, Fort Mill, SC 29715 and is currently estimated at $196,715, approximately $270 per square foot. 301 Heritage Pkwy Unit 301 is a home located in York County with nearby schools including Springfield Elementary School, Springfield Middle School, and Nation Ford High School.
Ownership History
Date
Name
Owned For
Owner Type
Purchase Details
Closed on
Sep 25, 2019
Sold by
Wallace Mary B and Wallace Briana M
Bought by
Lee Jodi Lynn
Current Estimated Value
Purchase Details
Closed on
Feb 3, 2017
Sold by
Brown Jeffrey Carl
Bought by
Wallace Mary B and Wallace Briana M
Purchase Details
Closed on
Apr 15, 2016
Sold by
Elrod Linda
Bought by
Brown Jeffrey Carl
Home Financials for this Owner
Home Financials are based on the most recent Mortgage that was taken out on this home.
Original Mortgage
$274,066
Interest Rate
3.68%
Mortgage Type
VA
Purchase Details
Closed on
Jun 13, 2014
Sold by
Estate Of Luther C Elrod Iii
Bought by
Elrod Linda
Purchase Details
Closed on
Jan 7, 2008
Sold by
Elrod Luther C and Mohle William P
Bought by
Elrod Luther C
Purchase Details
Closed on
Jul 18, 2005
Sold by
Darby Michael
Bought by
Elrod Luther C
Create a Home Valuation Report for This Property
The Home Valuation Report is an in-depth analysis detailing your home's value as well as a comparison with similar homes in the area
Home Values in the Area
Average Home Value in this Area
Purchase History
| Date | Buyer | Sale Price | Title Company |
|---|---|---|---|
| Lee Jodi Lynn | $75,000 | None Available | |
| Wallace Mary B | $70,000 | None Available | |
| Brown Jeffrey Carl | $30,000 | None Available | |
| Elrod Linda | -- | -- | |
| Elrod Luther C | $15,000 | Attorney | |
| Elrod Luther C | -- | -- |
Source: Public Records
Mortgage History
| Date | Status | Borrower | Loan Amount |
|---|---|---|---|
| Previous Owner | Brown Jeffrey Carl | $274,066 |
Source: Public Records
Tax History Compared to Growth
Tax History
| Year | Tax Paid | Tax Assessment Tax Assessment Total Assessment is a certain percentage of the fair market value that is determined by local assessors to be the total taxable value of land and additions on the property. | Land | Improvement |
|---|---|---|---|---|
| 2024 | $592 | $3,354 | $0 | $3,354 |
| 2023 | $574 | $3,354 | $0 | $3,354 |
| 2022 | $569 | $3,354 | $0 | $3,354 |
| 2021 | -- | $3,354 | $0 | $3,354 |
| 2020 | $611 | $3,354 | $0 | $0 |
| 2019 | $573 | $2,900 | $0 | $0 |
| 2018 | $605 | $2,740 | $0 | $0 |
| 2017 | $1,382 | $4,110 | $0 | $0 |
| 2016 | $1,338 | $3,270 | $0 | $0 |
| 2014 | $1,119 | $3,270 | $0 | $3,270 |
| 2013 | $1,119 | $3,480 | $0 | $3,480 |
Source: Public Records
Map
Nearby Homes
- 304 Heritage Pkwy Unit 304
- 2762 Victory Ct Unit F-8
- 498 Glory Ct
- 494 Glory Ct
- 704 Heritage Pkwy Unit 704
- 945 Heritage Pkwy
- 992 Cranberry Cir
- 971 Heritage Pkwy
- 498 Sweetgum Dr
- 500 Sweetgum Dr Unit 48C
- 2117 Middlebridge Ct
- 832 Summerlake Dr
- 445 Buttermere Rd
- 5288 Sweet Fig Way
- 382 Sweetgum Dr
- 729 Torrey Pines Ln
- 1625 Carolina Orchards Blvd
- 907 Summerlake Dr
- 3104 Highgate Dr
- 576 Putting Dr
- 302 Heritage Pkwy Unit 302
- 401 Heritage Pkwy
- 404 Heritage Pkwy
- 405 Heritage Pkwy Unit 405
- 404 Heritage Pkwy Unit 404
- 406 Heritage Pkwy
- 411 Heritage Pkwy Unit 112
- 305 Heritage Pkwy
- 306 Heritage Pkwy Unit 306
- 501 Heritage Pkwy
- 402 Heritage Pkwy
- 211 Heritage Pkwy
- 303 Heritage Pkwy Unit 303
- 206 Heritage Pkwy
- 205 Heritage Pkwy Unit 205
- 105 Heritage Pkwy
- 204 Heritage Pkwy Unit 204
- 104 Heritage Pkwy Unit 1
- 203 Heritage Pkwy
- 202 Heritage Pkwy