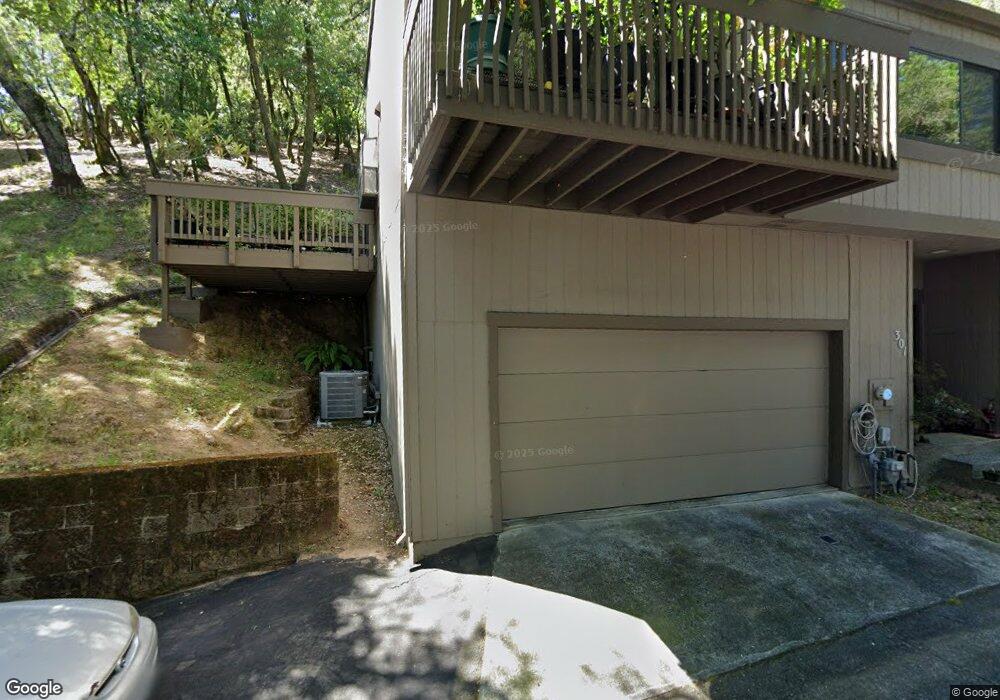
301 Indian Way Novato, CA 94949
Midwest Novato NeighborhoodEstimated Value: $713,000 - $789,000
3
Beds
2
Baths
1,849
Sq Ft
$404/Sq Ft
Est. Value
About This Home
This home is located at 301 Indian Way, Novato, CA 94949 and is currently estimated at $746,686, approximately $403 per square foot. 301 Indian Way is a home located in Marin County with nearby schools including Lynwood Elementary School, Novato High School, and Marin Christian Academy and Noah's Ark Preschool.
Ownership History
Date
Name
Owned For
Owner Type
Purchase Details
Closed on
Feb 26, 2010
Sold by
Lotosh Mikhail and Lotosh Yelena
Bought by
Lotosh Mikhail and Lotosh Yelena
Current Estimated Value
Home Financials for this Owner
Home Financials are based on the most recent Mortgage that was taken out on this home.
Original Mortgage
$284,900
Outstanding Balance
$90,583
Interest Rate
4.97%
Mortgage Type
New Conventional
Estimated Equity
$656,103
Purchase Details
Closed on
Sep 26, 2002
Sold by
Colwell Jenny M
Bought by
Lotosh Michael and Lotosh Helen
Home Financials for this Owner
Home Financials are based on the most recent Mortgage that was taken out on this home.
Original Mortgage
$359,600
Interest Rate
6.22%
Purchase Details
Closed on
Nov 29, 1993
Sold by
Colwell Jenny M and Colwell Jenny L
Bought by
Colwell Jenny M
Home Financials for this Owner
Home Financials are based on the most recent Mortgage that was taken out on this home.
Original Mortgage
$117,200
Interest Rate
3.87%
Create a Home Valuation Report for This Property
The Home Valuation Report is an in-depth analysis detailing your home's value as well as a comparison with similar homes in the area
Home Values in the Area
Average Home Value in this Area
Purchase History
| Date | Buyer | Sale Price | Title Company |
|---|---|---|---|
| Lotosh Mikhail | -- | Chicago Title Company | |
| Lotosh Michael | $400,000 | California Land Title | |
| Colwell Jenny M | -- | Old Republic Title Co |
Source: Public Records
Mortgage History
| Date | Status | Borrower | Loan Amount |
|---|---|---|---|
| Open | Lotosh Mikhail | $284,900 | |
| Closed | Lotosh Michael | $359,600 | |
| Previous Owner | Colwell Jenny M | $117,200 |
Source: Public Records
Tax History Compared to Growth
Tax History
| Year | Tax Paid | Tax Assessment Tax Assessment Total Assessment is a certain percentage of the fair market value that is determined by local assessors to be the total taxable value of land and additions on the property. | Land | Improvement |
|---|---|---|---|---|
| 2025 | $7,936 | $579,280 | $260,676 | $318,604 |
| 2024 | $7,936 | $567,923 | $255,565 | $312,358 |
| 2023 | $7,754 | $556,791 | $250,556 | $306,235 |
| 2022 | $7,571 | $545,875 | $245,644 | $300,231 |
| 2021 | $7,558 | $535,175 | $240,829 | $294,346 |
| 2020 | $7,444 | $529,691 | $238,361 | $291,330 |
| 2019 | $7,155 | $519,307 | $233,688 | $285,619 |
| 2018 | $7,046 | $509,127 | $229,107 | $280,020 |
| 2017 | $6,917 | $499,147 | $224,616 | $274,531 |
| 2016 | $6,436 | $489,363 | $220,213 | $269,150 |
| 2015 | $6,329 | $482,015 | $216,907 | $265,108 |
| 2014 | $5,351 | $394,682 | $177,607 | $217,075 |
Source: Public Records
Map
Nearby Homes
- 106 Indian Way
- 540 Marin Oaks Dr
- 1 Blue Oak Ct
- 22 Pierce Dr
- 101 Garner Dr
- 26 Brassie Ct
- 48 Cambridge Heights
- 5 Truman Dr
- 201 Deborah Ct
- 1 Columbine Ln
- 213 Deborah Ct
- 16 Burning Tree Dr
- 120 Fairway Dr
- 28 Washington St
- 45 Wimbledon Ct
- 306 Silvio Ln Unit 204
- 323 Silvio Ln Unit 4
- 10 Pebble Beach Dr
- 58 Scottsdale Way
- 8 Park Crest Ct Unit C
- 303 Indian Way
- 304 Indian Way
- 302 Indian Way
- 305 Indian Way
- 306 Indian Way
- 307 Indian Way
- 308 Indian Way
- 310 Indian Way
- 312 Indian Way
- 209 Indian Way
- 400 Indian Way
- 207 Indian Way
- 402 Indian Way
- 104 Indian Way
- 100 Indian Way
- 102 Indian Way
- 205 Indian Way
- 1737 Ignacio Blvd
- 1 Arrowhead Ln
- 404 Indian Way