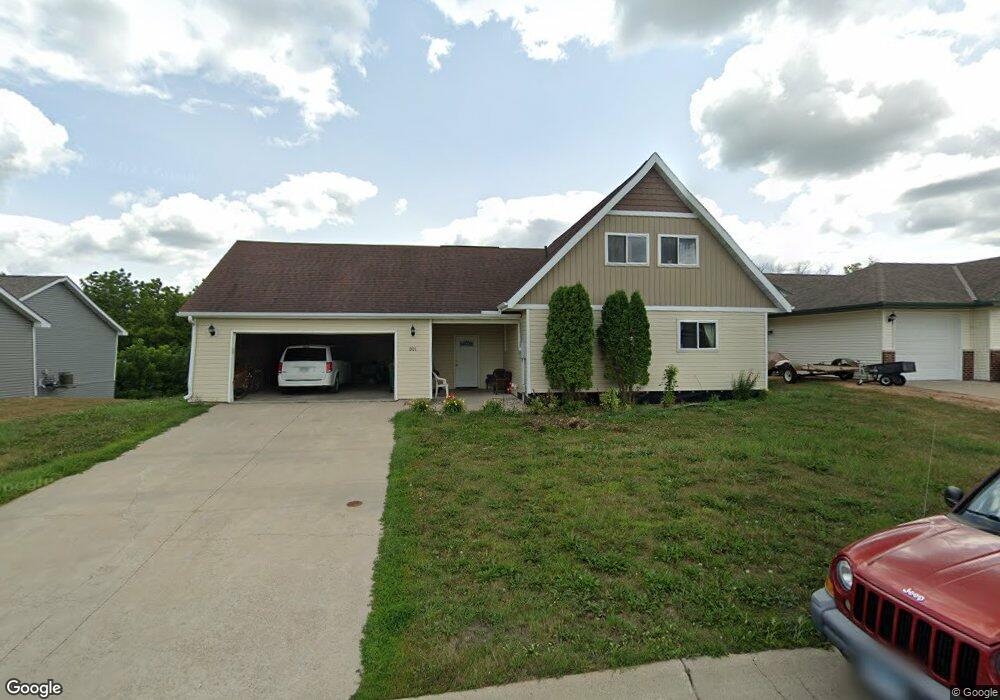
301 Juniper Ln NW Montgomery, MN 56069
Estimated Value: $315,000 - $376,000
3
Beds
2
Baths
1,625
Sq Ft
$209/Sq Ft
Est. Value
About This Home
This home is located at 301 Juniper Ln NW, Montgomery, MN 56069 and is currently estimated at $340,098, approximately $209 per square foot. 301 Juniper Ln NW is a home located in Le Sueur County with nearby schools including Tri-City United Montgomery PreK-8, Tri-City United Lonsdale PreK-6 Elementary School, and Tri-City United High School.
Ownership History
Date
Name
Owned For
Owner Type
Purchase Details
Closed on
Apr 6, 2017
Sold by
Anderson Matthew T and Anderson Jenny
Bought by
Fruitful Connections Llc
Current Estimated Value
Home Financials for this Owner
Home Financials are based on the most recent Mortgage that was taken out on this home.
Original Mortgage
$113,750
Outstanding Balance
$94,527
Interest Rate
4.16%
Mortgage Type
Unknown
Estimated Equity
$245,571
Purchase Details
Closed on
Mar 29, 2017
Sold by
Anderson Matthew T and Anderson Jenny
Bought by
Fruitful Connections Llc
Home Financials for this Owner
Home Financials are based on the most recent Mortgage that was taken out on this home.
Original Mortgage
$113,750
Outstanding Balance
$94,527
Interest Rate
4.16%
Mortgage Type
Unknown
Estimated Equity
$245,571
Purchase Details
Closed on
Apr 23, 2010
Sold by
Bliss Peter L and Bliss Joan P
Bought by
Anderson Matthew T
Purchase Details
Closed on
Aug 20, 2008
Sold by
Drp One Inc
Bought by
Bliss Peter and Bliss Joan P
Create a Home Valuation Report for This Property
The Home Valuation Report is an in-depth analysis detailing your home's value as well as a comparison with similar homes in the area
Home Values in the Area
Average Home Value in this Area
Purchase History
| Date | Buyer | Sale Price | Title Company |
|---|---|---|---|
| Fruitful Connections Llc | $162,500 | -- | |
| Fruitful Connections Llc | $162,500 | -- | |
| Anderson Matthew T | $131,500 | -- | |
| Bliss Peter | $10,000 | -- |
Source: Public Records
Mortgage History
| Date | Status | Borrower | Loan Amount |
|---|---|---|---|
| Open | Fruitful Connections Llc | $113,750 |
Source: Public Records
Tax History Compared to Growth
Tax History
| Year | Tax Paid | Tax Assessment Tax Assessment Total Assessment is a certain percentage of the fair market value that is determined by local assessors to be the total taxable value of land and additions on the property. | Land | Improvement |
|---|---|---|---|---|
| 2025 | $5,502 | $331,100 | $57,600 | $273,500 |
| 2024 | $4,968 | $334,200 | $57,600 | $276,600 |
| 2023 | $4,780 | $334,200 | $57,600 | $276,600 |
| 2022 | $4,290 | $311,700 | $57,600 | $254,100 |
| 2021 | $4,144 | $252,300 | $55,600 | $196,700 |
| 2020 | $3,778 | $240,800 | $52,600 | $188,200 |
| 2019 | $3,698 | $217,000 | $52,600 | $164,400 |
| 2018 | $3,683 | $202,900 | $52,600 | $150,300 |
| 2017 | $2,979 | $160,800 | $43,895 | $116,905 |
| 2016 | $3,096 | $143,000 | $39,424 | $103,576 |
| 2015 | $2,937 | $143,000 | $39,424 | $103,576 |
| 2014 | $2,487 | $110,900 | $33,131 | $77,769 |
| 2013 | $2,380 | $106,100 | $32,758 | $73,342 |
Source: Public Records
Map
Nearby Homes
- 804 Juniper Ln NW
- 406 5th St NW
- 507 Welco Ln W
- 106 4th St SW
- 609 E Welco Dr
- 508 Oak Ave SW
- 209 Oak Ave SW
- 305 Elm Ave SE
- 400 Elm Ave SE
- 105 N Circle Dr
- 218 6th St NE
- 220 6th St NE
- 600 Boulevard Ave NE
- 601 Mill Ave NE
- 619 Fir Ave NE
- 921 Mulberry Ave NE
- 1114 Sunset Blvd NW
- 900 Mulberry Ave NE
- 1003 Mulberry Ave NE
- 900 Emily Ct NE
- 303 Juniper Ln NW
- 209 Juniper Ln NW
- 207 Juniper Ln NW
- 305 Juniper Ln NW
- 300 Juniper Ln NW
- 210 Juniper Ln NW
- 208 6th St NW
- 302 Juniper Ln NW
- 513 Fir Ave NW
- 208 Juniper Ln NW
- 307 Juniper Ln NW
- 205 Juniper Ln NW
- 304 Juniper Ln NW
- 511 Fir Ave NW
- 206 Juniper Ln NW
- 401 Juniper Ln NW
- 303 Fischer St NW
- 301 Fischer St NW
- 607 Spruce Ave NW
- 603 Spruce Ave NW