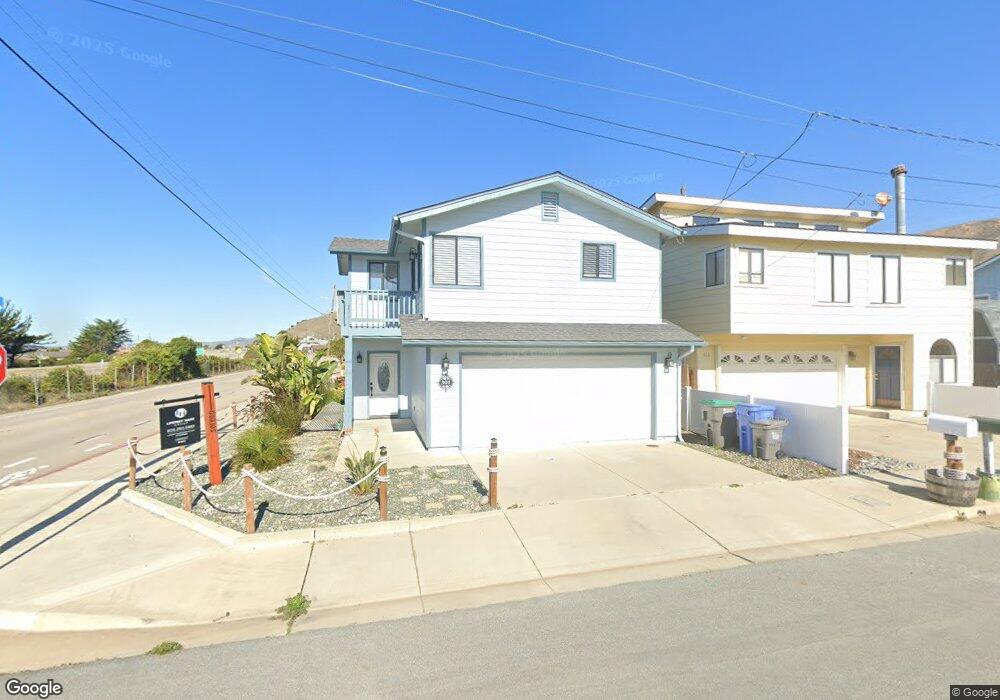
301 Kodiak St Morro Bay, CA 93442
Estimated Value: $837,845 - $910,000
3
Beds
2
Baths
1,400
Sq Ft
$623/Sq Ft
Est. Value
About This Home
This home is located at 301 Kodiak St, Morro Bay, CA 93442 and is currently estimated at $871,961, approximately $622 per square foot. 301 Kodiak St is a home located in San Luis Obispo County with nearby schools including Del Mar Elementary School, Los Osos Middle School, and Morro Bay High School.
Ownership History
Date
Name
Owned For
Owner Type
Purchase Details
Closed on
Nov 23, 1998
Sold by
Decicco Franco and Decicco Sonia
Bought by
Decicco Franco and Decicco Sonia
Current Estimated Value
Purchase Details
Closed on
Aug 27, 1998
Sold by
Mcintosh Ronald F and Leontieff Nick W
Bought by
Decicco Franco and Decicco Sonia
Home Financials for this Owner
Home Financials are based on the most recent Mortgage that was taken out on this home.
Original Mortgage
$140,000
Outstanding Balance
$29,854
Interest Rate
6.88%
Estimated Equity
$842,107
Create a Home Valuation Report for This Property
The Home Valuation Report is an in-depth analysis detailing your home's value as well as a comparison with similar homes in the area
Home Values in the Area
Average Home Value in this Area
Purchase History
| Date | Buyer | Sale Price | Title Company |
|---|---|---|---|
| Decicco Franco | -- | -- | |
| Decicco Franco | $194,000 | Fidelity National Title Co |
Source: Public Records
Mortgage History
| Date | Status | Borrower | Loan Amount |
|---|---|---|---|
| Open | Decicco Franco | $140,000 |
Source: Public Records
Tax History
| Year | Tax Paid | Tax Assessment Tax Assessment Total Assessment is a certain percentage of the fair market value that is determined by local assessors to be the total taxable value of land and additions on the property. | Land | Improvement |
|---|---|---|---|---|
| 2025 | $3,295 | $304,110 | $109,728 | $194,382 |
| 2024 | $3,235 | $298,148 | $107,577 | $190,571 |
| 2023 | $3,235 | $292,303 | $105,468 | $186,835 |
| 2022 | $3,033 | $286,572 | $103,400 | $183,172 |
| 2021 | $2,984 | $280,954 | $101,373 | $179,581 |
| 2020 | $2,954 | $278,074 | $100,334 | $177,740 |
| 2019 | $2,923 | $272,622 | $98,367 | $174,255 |
| 2018 | $2,866 | $267,278 | $96,439 | $170,839 |
| 2017 | $2,810 | $262,039 | $94,549 | $167,490 |
| 2016 | $2,755 | $256,902 | $92,696 | $164,206 |
| 2015 | $2,713 | $253,044 | $91,304 | $161,740 |
| 2014 | $2,491 | $248,088 | $89,516 | $158,572 |
Source: Public Records
Map
Nearby Homes
- 390 Nassau St
- 351 Nevis St
- 440 Luzon St
- 410 Island St
- 390 Panay St
- 498 Orcas St
- 3058 Main St
- 3020 Ironwood Ave
- 3329 Panorama Dr Unit 30
- 2900 Alder Ave
- 670 Sequoia Ct
- 530 Zanzibar St
- 650 Sequoia Ct
- 2783 Coral Ave
- 2845 Ironwood Ave
- 2785 Hemlock Ave
- 679 Elena St
- 5010 Cabrillo Hwy
- 2600 Ironwood Ave
- 2581 Juniper Ave
Your Personal Tour Guide
Ask me questions while you tour the home.