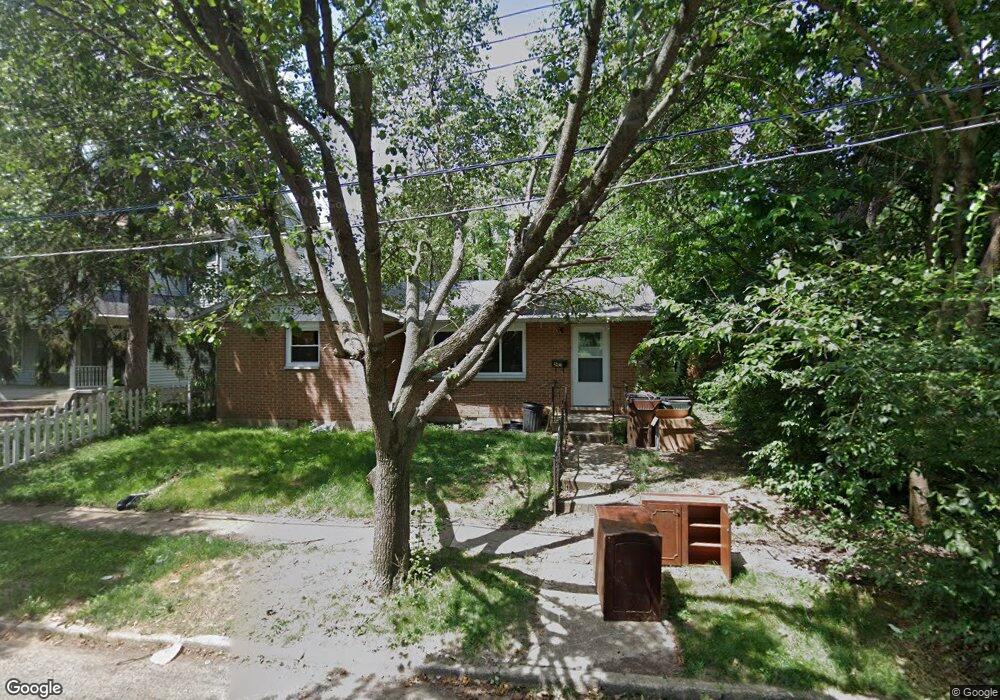
301 Lake Ave Franklin, OH 45005
Estimated Value: $19,000 - $150,000
2
Beds
1
Bath
956
Sq Ft
$119/Sq Ft
Est. Value
About This Home
This home is located at 301 Lake Ave, Franklin, OH 45005 and is currently estimated at $113,910, approximately $119 per square foot. 301 Lake Ave is a home located in Warren County with nearby schools including Franklin High School and The CinDay Academy.
Ownership History
Date
Name
Owned For
Owner Type
Purchase Details
Closed on
Oct 24, 2024
Sold by
Osborne Gloria K
Bought by
Tbd Real Estate Llc
Current Estimated Value
Purchase Details
Closed on
Mar 1, 2004
Sold by
Shiftlett Barbara A
Bought by
Shiftlett Barbara A and Osborne Gloria K
Home Financials for this Owner
Home Financials are based on the most recent Mortgage that was taken out on this home.
Original Mortgage
$56,100
Interest Rate
5.65%
Mortgage Type
New Conventional
Purchase Details
Closed on
May 15, 1998
Sold by
Shiflett Ruth E
Bought by
Shiflett Barbara A
Home Financials for this Owner
Home Financials are based on the most recent Mortgage that was taken out on this home.
Original Mortgage
$49,400
Interest Rate
7.25%
Mortgage Type
FHA
Purchase Details
Closed on
Sep 25, 1980
Sold by
Shiflett Shiflett and Shiflett Thomas
Create a Home Valuation Report for This Property
The Home Valuation Report is an in-depth analysis detailing your home's value as well as a comparison with similar homes in the area
Home Values in the Area
Average Home Value in this Area
Purchase History
| Date | Buyer | Sale Price | Title Company |
|---|---|---|---|
| Tbd Real Estate Llc | $17,500 | Wave Title | |
| Shiftlett Barbara A | -- | Chicago Title Insurance Comp | |
| Shiflett Barbara A | $50,000 | -- | |
| -- | -- | -- |
Source: Public Records
Mortgage History
| Date | Status | Borrower | Loan Amount |
|---|---|---|---|
| Previous Owner | Shiftlett Barbara A | $56,100 | |
| Previous Owner | Shiflett Barbara A | $49,400 |
Source: Public Records
Tax History Compared to Growth
Tax History
| Year | Tax Paid | Tax Assessment Tax Assessment Total Assessment is a certain percentage of the fair market value that is determined by local assessors to be the total taxable value of land and additions on the property. | Land | Improvement |
|---|---|---|---|---|
| 2024 | $1,663 | $32,480 | $8,240 | $24,240 |
| 2023 | $934 | $25,151 | $5,453 | $19,698 |
| 2022 | $918 | $25,151 | $5,453 | $19,698 |
| 2021 | $874 | $25,151 | $5,453 | $19,698 |
| 2020 | $704 | $20,118 | $4,361 | $15,757 |
| 2019 | $647 | $20,118 | $4,361 | $15,757 |
| 2018 | $648 | $20,118 | $4,361 | $15,757 |
| 2017 | $1,151 | $19,667 | $4,330 | $15,337 |
| 2016 | $1,172 | $19,667 | $4,330 | $15,337 |
| 2015 | $1,172 | $19,667 | $4,330 | $15,337 |
| 2014 | $1,118 | $19,670 | $4,330 | $15,340 |
| 2013 | $960 | $22,020 | $4,850 | $17,170 |
Source: Public Records
Map
Nearby Homes
- 1504 Knightsbridge Ct
- 105 Chestnut St Unit 1
- 605 Spring Ave
- 315 Bridge St
- 0 E 4th St
- 102 Warren Ave
- 213 Locust St
- 521 S Main St
- 0 Victoria Dr Unit 1852824
- 0 Victoria Dr Unit 942075
- 627 S River St
- 631 S River St
- 7 Highland St
- 519 Anderson St
- 233 S Main St
- 235 S Main St
- 121 E 5th St
- 1200 Riley Blvd
- 820 S River St
- 551 E 2nd St