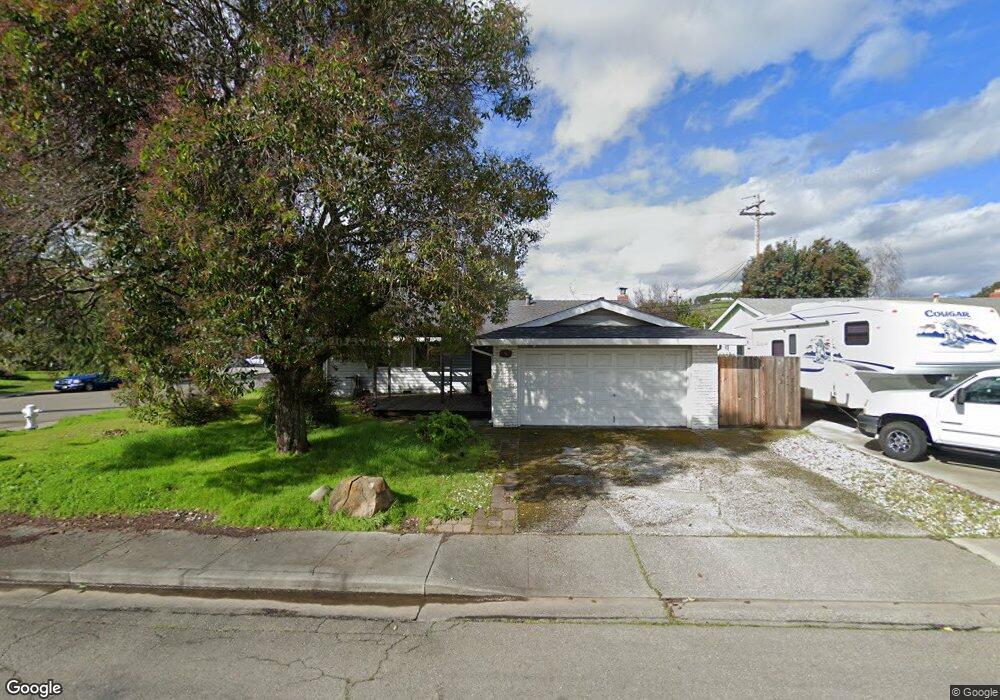
301 Lily St Fairfield, CA 94533
Estimated Value: $433,000 - $512,641
4
Beds
2
Baths
1,438
Sq Ft
$339/Sq Ft
Est. Value
About This Home
This home is located at 301 Lily St, Fairfield, CA 94533 and is currently estimated at $487,910, approximately $339 per square foot. 301 Lily St is a home located in Solano County with nearby schools including Dover Elementary School, Grange Middle School, and Fairfield High School.
Ownership History
Date
Name
Owned For
Owner Type
Purchase Details
Closed on
Jun 19, 2001
Sold by
Halvorson Marie D
Bought by
Johnson Richard D
Current Estimated Value
Home Financials for this Owner
Home Financials are based on the most recent Mortgage that was taken out on this home.
Original Mortgage
$142,000
Outstanding Balance
$54,091
Interest Rate
7.14%
Estimated Equity
$433,819
Create a Home Valuation Report for This Property
The Home Valuation Report is an in-depth analysis detailing your home's value as well as a comparison with similar homes in the area
Home Values in the Area
Average Home Value in this Area
Purchase History
We collect this data history from publicly available records. To have your information removed, we recommend requesting removal directly through your county’s website.
| Date | Buyer | Sale Price | Title Company |
|---|---|---|---|
| Johnson Richard D | $217,000 | -- |
Source: Public Records
Mortgage History
We collect this data history from publicly available records. To have your information removed, we recommend requesting removal directly through your county’s website.
| Date | Status | Borrower | Loan Amount |
|---|---|---|---|
| Open | Johnson Richard D | $142,000 | |
| Closed | Johnson Richard D | $21,700 |
Source: Public Records
Tax History
| Year | Tax Paid | Tax Assessment Tax Assessment Total Assessment is a certain percentage of the fair market value that is determined by local assessors to be the total taxable value of land and additions on the property. | Land | Improvement |
|---|---|---|---|---|
| 2025 | $3,663 | $326,976 | $82,870 | $244,106 |
| 2024 | $3,663 | $320,566 | $81,246 | $239,320 |
| 2023 | $3,550 | $314,281 | $79,653 | $234,628 |
| 2022 | $3,507 | $308,120 | $78,092 | $230,028 |
| 2021 | $3,473 | $302,079 | $76,561 | $225,518 |
| 2020 | $3,392 | $298,982 | $75,776 | $223,206 |
| 2019 | $3,308 | $293,121 | $74,291 | $218,830 |
| 2018 | $3,415 | $287,375 | $72,835 | $214,540 |
| 2017 | $3,257 | $281,741 | $71,407 | $210,334 |
| 2016 | $3,231 | $276,217 | $70,007 | $206,210 |
| 2015 | $3,005 | $271,000 | $62,000 | $209,000 |
| 2014 | $2,636 | $235,000 | $56,000 | $179,000 |
Source: Public Records
Map
Nearby Homes
- 307 Lily St
- 338 Begonia Blvd
- 320 Begonia Blvd
- 333 Begonia Blvd
- 327 Begonia Blvd
- 339 Lily St
- 344 Begonia Blvd
- 321 Begonia Blvd
- 339 Begonia Blvd
- 302 Lily St
- 310 Begonia Blvd
- 345 Lily St
- 345 Begonia Blvd
- 315 Begonia Blvd
- 350 Begonia Blvd
- 308 Lily St
- 332 Tulip St
- 338 Tulip St
- 351 Lily St
- 351 Begonia Blvd
Your Personal Tour Guide
Ask me questions while you tour the home.