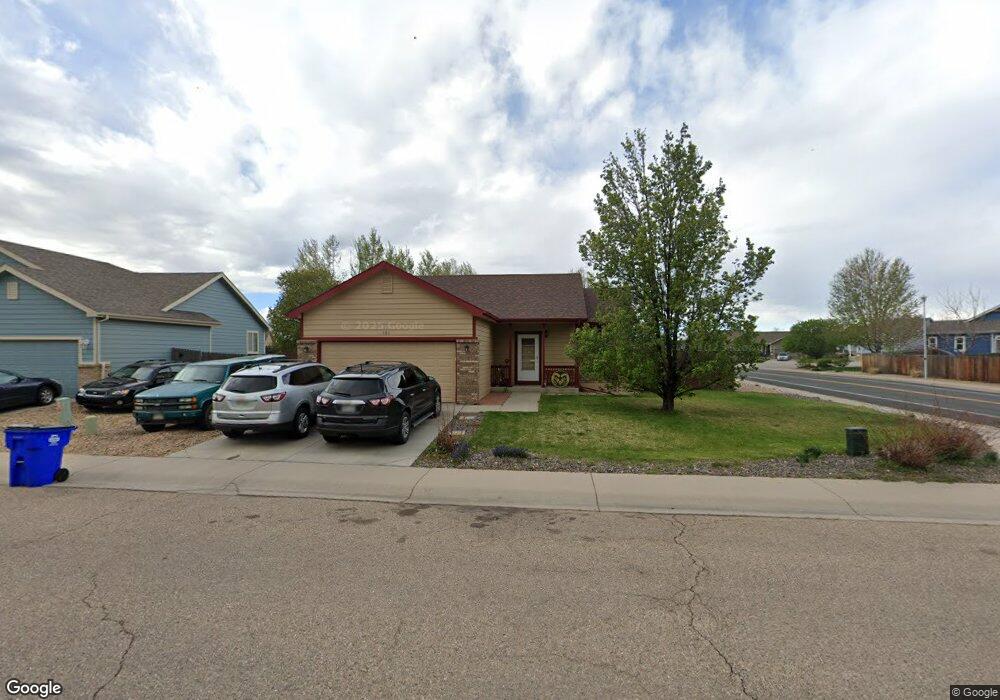
301 Marble Ct Windsor, CO 80550
Estimated Value: $414,000 - $448,000
3
Beds
2
Baths
1,032
Sq Ft
$422/Sq Ft
Est. Value
About This Home
This home is located at 301 Marble Ct, Windsor, CO 80550 and is currently estimated at $435,886, approximately $422 per square foot. 301 Marble Ct is a home located in Weld County with nearby schools including Tozer Elementary School, Mountain View Elementary School, and Windsor Middle School.
Ownership History
Date
Name
Owned For
Owner Type
Purchase Details
Closed on
Jul 3, 2003
Sold by
Hernandez Clara J and Hernandez Patrick
Bought by
Hernandez Patrick and Hernandez Clara
Current Estimated Value
Home Financials for this Owner
Home Financials are based on the most recent Mortgage that was taken out on this home.
Original Mortgage
$136,373
Outstanding Balance
$56,344
Interest Rate
5.23%
Mortgage Type
FHA
Estimated Equity
$379,542
Purchase Details
Closed on
Jul 28, 2000
Sold by
Lifestructures Llc
Bought by
Hernandez Clara J and Hernandez Patrick
Home Financials for this Owner
Home Financials are based on the most recent Mortgage that was taken out on this home.
Original Mortgage
$132,925
Interest Rate
8.15%
Mortgage Type
FHA
Purchase Details
Closed on
Feb 9, 2000
Sold by
Windsor Cornerstone Llc
Bought by
Rossi Homes Inc
Create a Home Valuation Report for This Property
The Home Valuation Report is an in-depth analysis detailing your home's value as well as a comparison with similar homes in the area
Purchase History
| Date | Buyer | Sale Price | Title Company |
|---|---|---|---|
| Hernandez Patrick | -- | Land Title | |
| Hernandez Clara J | $133,832 | Stewart Title | |
| Rossi Homes Inc | $363,500 | -- |
Source: Public Records
Mortgage History
| Date | Status | Borrower | Loan Amount |
|---|---|---|---|
| Open | Hernandez Patrick | $136,373 | |
| Closed | Hernandez Clara J | $132,925 |
Source: Public Records
Tax History
| Year | Tax Paid | Tax Assessment Tax Assessment Total Assessment is a certain percentage of the fair market value that is determined by local assessors to be the total taxable value of land and additions on the property. | Land | Improvement |
|---|---|---|---|---|
| 2025 | $2,205 | $26,490 | $5,630 | $20,860 |
| 2024 | $2,205 | $26,490 | $5,630 | $20,860 |
| 2023 | $2,024 | $26,970 | $4,740 | $22,230 |
| 2022 | $2,003 | $20,550 | $4,450 | $16,100 |
| 2021 | $1,867 | $21,140 | $4,580 | $16,560 |
| 2020 | $1,754 | $20,250 | $3,930 | $16,320 |
| 2019 | $1,739 | $20,250 | $3,930 | $16,320 |
| 2018 | $1,575 | $17,360 | $2,880 | $14,480 |
| 2017 | $1,667 | $17,360 | $2,880 | $14,480 |
| 2016 | $1,409 | $14,820 | $2,790 | $12,030 |
| 2015 | $1,311 | $14,820 | $2,790 | $12,030 |
| 2014 | $1,292 | $13,700 | $2,790 | $10,910 |
Source: Public Records
Map
Nearby Homes
- 883 Emerald Dr
- 305 Amber Dr
- 763 Ponderosa Dr
- 970 Greenbrook Dr
- 960 Ashbrook Dr
- 949 Ashbrook Dr
- 902 Maplebrook Dr
- 937 Greenbrook Dr
- 368 Littlebrook Ct
- 725 Columbine Dr
- 75 Lodgepole Dr
- 218 E Chestnut St Unit 4
- 147 Crabapple Dr
- 713 Apple Ct
- 1343 Lake Cir Unit 8B
- 124 Beacon Way Unit 3
- 288 E Chestnut St Unit 2
- 149 Sunflower Dr
- 138 Sunflower Dr
- 1025 Valley Dr
Your Personal Tour Guide
Ask me questions while you tour the home.