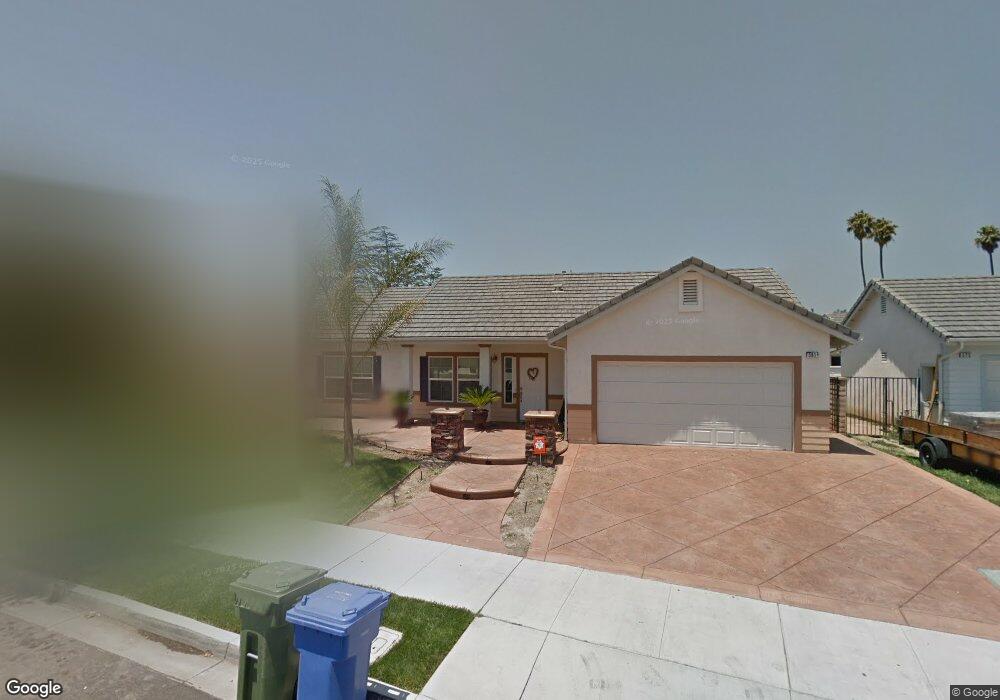
301 Millard St Moorpark, CA 93021
Estimated Value: $707,000 - $795,297
3
Beds
2
Baths
1,470
Sq Ft
$517/Sq Ft
Est. Value
About This Home
This home is located at 301 Millard St, Moorpark, CA 93021 and is currently estimated at $760,574, approximately $517 per square foot. 301 Millard St is a home located in Ventura County with nearby schools including Mountain Meadows Elementary School, Chaparral Middle School, and Moorpark High School.
Ownership History
Date
Name
Owned For
Owner Type
Purchase Details
Closed on
Sep 25, 2023
Sold by
Vasquez Francisco Perez and Vasquez Alma Delia
Bought by
Francisco Perez And Alma Gutierrez Family Tru and Vasquez
Current Estimated Value
Purchase Details
Closed on
Jun 21, 2023
Sold by
Gutierrez Vasquez Esequiel
Bought by
Vasquez Francisco Perez and Vasquez Alma Delia
Purchase Details
Closed on
Mar 12, 2009
Sold by
Gutierrez Petra
Bought by
Vasquez Esequiel Gutierrez
Purchase Details
Closed on
Feb 27, 2009
Sold by
Villa Roberto
Bought by
Vasquez Esequiel Gutierrez and Vasquez Francisco Perez
Purchase Details
Closed on
Jan 20, 2004
Sold by
Tr Partners Llc
Bought by
Villa Roberto
Home Financials for this Owner
Home Financials are based on the most recent Mortgage that was taken out on this home.
Original Mortgage
$352,950
Interest Rate
5.84%
Mortgage Type
Stand Alone First
Create a Home Valuation Report for This Property
The Home Valuation Report is an in-depth analysis detailing your home's value as well as a comparison with similar homes in the area
Home Values in the Area
Average Home Value in this Area
Purchase History
| Date | Buyer | Sale Price | Title Company |
|---|---|---|---|
| Francisco Perez And Alma Gutierrez Family Tru | -- | None Listed On Document | |
| Vasquez Francisco Perez | -- | None Listed On Document | |
| Vasquez Esequiel Gutierrez | -- | Ticor Title Company | |
| Vasquez Esequiel Gutierrez | $380,000 | Ticor Title Company | |
| Villa Roberto | $395,000 | First American Title Co |
Source: Public Records
Mortgage History
| Date | Status | Borrower | Loan Amount |
|---|---|---|---|
| Previous Owner | Villa Roberto | $352,950 |
Source: Public Records
Tax History Compared to Growth
Tax History
| Year | Tax Paid | Tax Assessment Tax Assessment Total Assessment is a certain percentage of the fair market value that is determined by local assessors to be the total taxable value of land and additions on the property. | Land | Improvement |
|---|---|---|---|---|
| 2025 | $7,065 | $660,824 | $392,837 | $267,987 |
| 2024 | $7,065 | $647,867 | $385,134 | $262,733 |
| 2023 | $5,152 | $470,333 | $235,167 | $235,166 |
| 2022 | $5,019 | $461,111 | $230,556 | $230,555 |
| 2021 | $5,009 | $452,070 | $226,035 | $226,035 |
| 2020 | $4,962 | $447,436 | $223,718 | $223,718 |
| 2019 | $4,851 | $438,664 | $219,332 | $219,332 |
| 2018 | $4,802 | $430,064 | $215,032 | $215,032 |
| 2017 | $4,702 | $421,632 | $210,816 | $210,816 |
| 2016 | $4,613 | $413,366 | $206,683 | $206,683 |
| 2015 | $4,550 | $407,158 | $203,579 | $203,579 |
| 2014 | $4,427 | $399,184 | $199,592 | $199,592 |
Source: Public Records
Map
Nearby Homes
- 445 Millard St
- 31 Fremont Ave
- 13191 Westcott Ct
- 540 Spring Rd Unit 94
- 540 Spring Rd Unit 93
- 150 Majestic Ct Unit 1102
- 4566 N Canyonlands Rd
- 4529 N Canyonlands Rd
- 4540 Mill Valley Rd
- 1363 Walnut Canyon Rd
- 13191 Honeybee St
- 4543 Silverbell Cir
- 13729 Bear Valley Rd
- 4175 Shady Point Dr
- 13749 Gunsmoke Rd
- 4833 E Beltramo Ranch Rd
- Plan 2428 Modeled at The Bungalows at Beltramo
- Plan 2288 Modeled at The Bungalows at Beltramo
- Plan 1908 at The Bungalows at Beltramo
- 4844 Arroyo Run