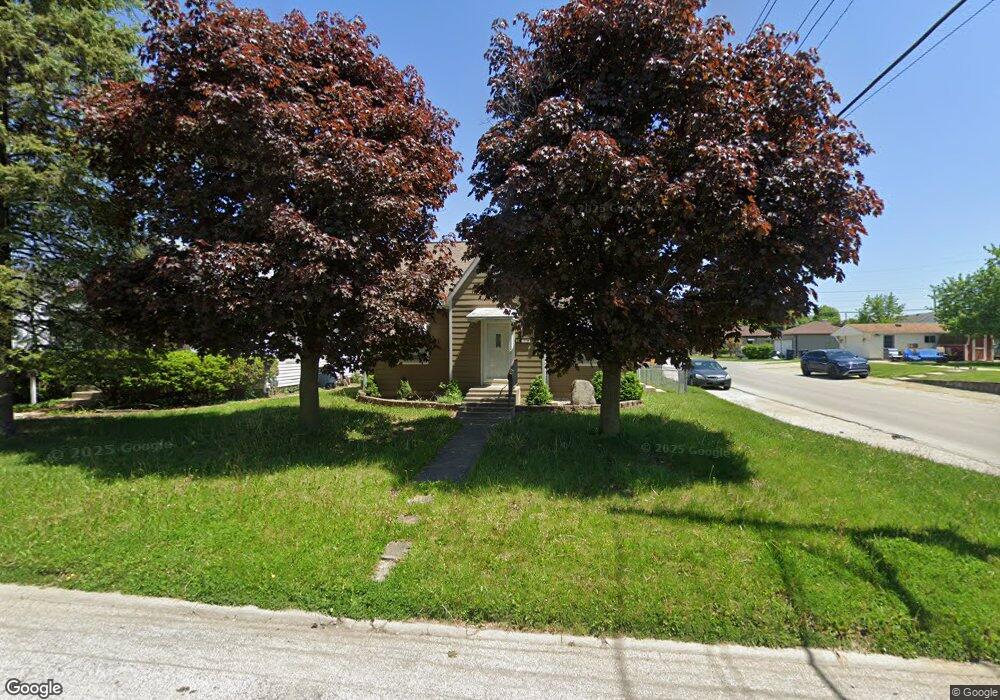
301 N 18th Ave Beech Grove, IN 46107
Estimated Value: $188,000 - $209,000
3
Beds
1
Bath
1,320
Sq Ft
$150/Sq Ft
Est. Value
About This Home
This home is located at 301 N 18th Ave, Beech Grove, IN 46107 and is currently estimated at $198,648, approximately $150 per square foot. 301 N 18th Ave is a home located in Marion County with nearby schools including Hornet Park Elementary School, Central Elementary School, and South Grove Intermediate School.
Ownership History
Date
Name
Owned For
Owner Type
Purchase Details
Closed on
Dec 20, 2024
Sold by
Bowman Michael E
Bought by
Bowman Lane Samuel
Current Estimated Value
Purchase Details
Closed on
Sep 17, 2008
Sold by
Craig Charles R and Craig Ruth L
Bought by
Bowman Michael E
Home Financials for this Owner
Home Financials are based on the most recent Mortgage that was taken out on this home.
Original Mortgage
$79,200
Interest Rate
6.52%
Mortgage Type
Purchase Money Mortgage
Create a Home Valuation Report for This Property
The Home Valuation Report is an in-depth analysis detailing your home's value as well as a comparison with similar homes in the area
Home Values in the Area
Average Home Value in this Area
Purchase History
| Date | Buyer | Sale Price | Title Company |
|---|---|---|---|
| Bowman Lane Samuel | -- | None Listed On Document | |
| Bowman Michael E | -- | None Available |
Source: Public Records
Mortgage History
| Date | Status | Borrower | Loan Amount |
|---|---|---|---|
| Previous Owner | Bowman Michael E | $79,200 |
Source: Public Records
Tax History Compared to Growth
Tax History
| Year | Tax Paid | Tax Assessment Tax Assessment Total Assessment is a certain percentage of the fair market value that is determined by local assessors to be the total taxable value of land and additions on the property. | Land | Improvement |
|---|---|---|---|---|
| 2024 | $3,913 | $134,500 | $20,300 | $114,200 |
| 2023 | $3,913 | $139,600 | $20,300 | $119,300 |
| 2022 | $3,781 | $132,400 | $20,300 | $112,100 |
| 2021 | $3,253 | $117,700 | $20,300 | $97,400 |
| 2020 | $3,010 | $115,700 | $20,300 | $95,400 |
| 2019 | $1,222 | $104,200 | $16,700 | $87,500 |
| 2018 | $1,030 | $91,500 | $16,700 | $74,800 |
| 2017 | $993 | $87,100 | $16,700 | $70,400 |
| 2016 | $966 | $85,500 | $16,700 | $68,800 |
| 2014 | $937 | $85,800 | $16,700 | $69,100 |
| 2013 | $903 | $85,000 | $16,700 | $68,300 |
Source: Public Records
Map
Nearby Homes
- 306 N 18th Ave
- 301 N 17th Ave
- 258 N 16th Ave
- 415 N 17th Ave
- 2180 Cleveland St
- 1617 Capra Ct
- 1614 Capra Ct
- 1701 Southern Ave
- 1601 Southern Ave
- 2021 Prospect St
- 426 N 14th Ave
- 1526 Main St
- 2215 Albany St
- 30 Gilbert Ave
- 62 N 13th Ave
- 437 N 13th Ave
- 3603 Margaret Ave
- 7 Chester Dr
- 2832 S Oakland Ave
- 1995 Britton Dr