N
Seller's Agent in 2013
Non MLS
SCK MLS
Estimated Value: $72,432 - $111,000
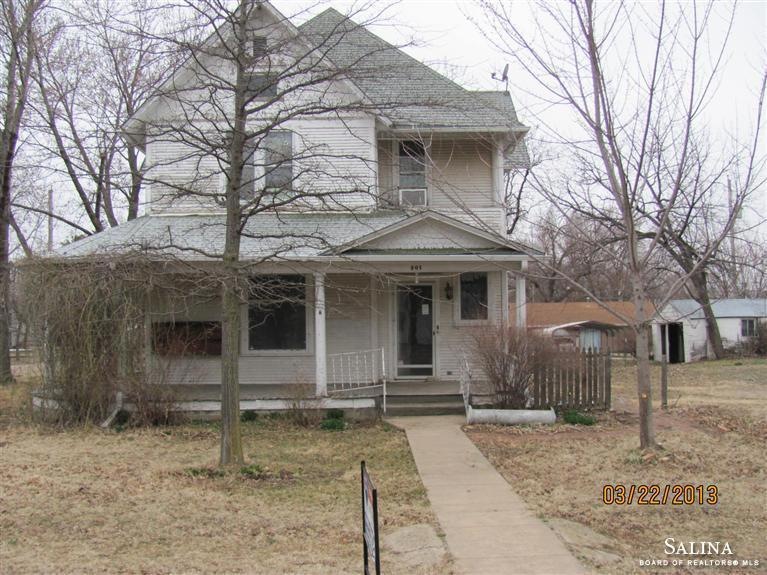
This home is located at 301 N Custer St, Delphos, KS 67436 since 19 March 2013 and is currently estimated at $90,608, approximately $38 per square foot. This property was built in 1920. 301 N Custer St is a home located in Ottawa County with nearby schools including Minneapolis Elementary School and Minneapolis High School.
Last Agent to Sell the Property
Non MLS
SCK MLS Listed on: 03/19/2013
| Date | Buyer | Sale Price | Title Company |
|---|---|---|---|
| Montague Brian | -- | -- | |
| Jpmorgan Chase Bank Na | $30,000 | -- | |
| Bowles Edward J | -- | -- |
| Date | Status | Borrower | Loan Amount |
|---|---|---|---|
| Open | Montague Brian | $33,900 | |
| Previous Owner | Bowles Edward J | $53,600 | |
| Previous Owner | Bowles Edward J | $13,400 |
| Date | Event | Price | List to Sale | Price per Sq Ft |
|---|---|---|---|---|
| 06/14/2013 06/14/13 | Sold | -- | -- | -- |
| 05/15/2013 05/15/13 | Pending | -- | -- | -- |
| 03/19/2013 03/19/13 | For Sale | $39,900 | -- | $17 / Sq Ft |
| Year | Tax Paid | Tax Assessment Tax Assessment Total Assessment is a certain percentage of the fair market value that is determined by local assessors to be the total taxable value of land and additions on the property. | Land | Improvement |
|---|---|---|---|---|
| 2025 | $1,436 | $7,350 | $202 | $7,148 |
| 2024 | $1,436 | $7,104 | $202 | $6,902 |
| 2023 | $1,403 | $6,843 | $202 | $6,641 |
| 2022 | $1,028 | $4,901 | $202 | $4,699 |
| 2021 | $978 | $4,479 | $202 | $4,277 |
| 2020 | $978 | $4,439 | $202 | $4,237 |
| 2019 | $989 | $4,439 | $202 | $4,237 |
| 2018 | $1,021 | $4,662 | $202 | $4,460 |
| 2017 | $1,010 | $4,520 | $202 | $4,318 |
| 2016 | $1,014 | $4,520 | $202 | $4,318 |
| 2015 | -- | $4,454 | $202 | $4,252 |
| 2014 | -- | $4,454 | $202 | $4,252 |
N
Seller's Agent in 2013
Non MLS
SCK MLS
Source: South Central Kansas MLS
MLS Number: 401852
APN: 045-16-0-10-12-006.00-0
Disclaimer: Certain information contained herein is derived from information provided by parties other than Homes.com. All information provided is deemed reliable, but is not guaranteed to be accurate and should be independently verified.
![]() IDX information is provided exclusively for personal, non-commercial use, and may not be used for any purpose other than to identify prospective properties consumers may be interested in purchasing. This information is not verified for authenticity or accuracy, is not guaranteed and may not reflect all real estate activity in the market. © 1993-2025 South Central Kansas Multiple Listing Service, Inc. All rights reserved.
IDX information is provided exclusively for personal, non-commercial use, and may not be used for any purpose other than to identify prospective properties consumers may be interested in purchasing. This information is not verified for authenticity or accuracy, is not guaranteed and may not reflect all real estate activity in the market. © 1993-2025 South Central Kansas Multiple Listing Service, Inc. All rights reserved.