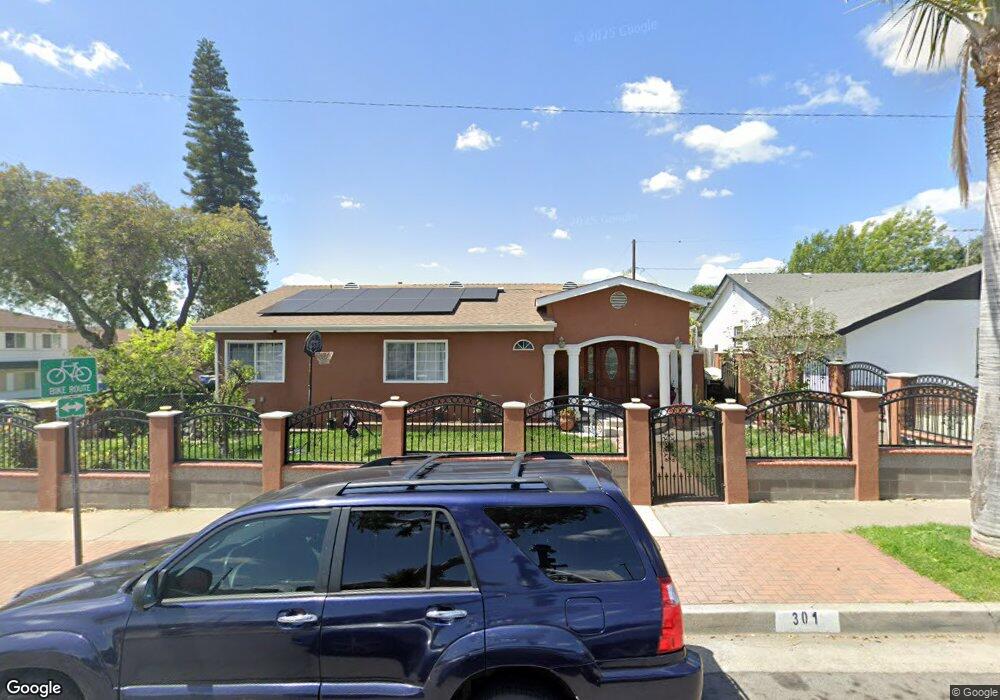
301 N Fonda St La Habra, CA 90631
Estimated Value: $826,000 - $910,682
4
Beds
3
Baths
1,646
Sq Ft
$532/Sq Ft
Est. Value
About This Home
This home is located at 301 N Fonda St, La Habra, CA 90631 and is currently estimated at $875,171, approximately $531 per square foot. 301 N Fonda St is a home located in Orange County with nearby schools including Sierra Vista Elementary School, Ladera Palma Elementary School, and Washington Middle School.
Ownership History
Date
Name
Owned For
Owner Type
Purchase Details
Closed on
Sep 10, 2004
Sold by
Elizarraras Gerardo and Elizarraras Maria
Bought by
Elizarraras Gerardo and Elizarraras Maria
Current Estimated Value
Home Financials for this Owner
Home Financials are based on the most recent Mortgage that was taken out on this home.
Original Mortgage
$238,000
Outstanding Balance
$113,878
Interest Rate
5.37%
Mortgage Type
Purchase Money Mortgage
Estimated Equity
$761,293
Purchase Details
Closed on
Jun 20, 2001
Sold by
Lopez Sergio Filiberto and Lopez Elida Ruth
Bought by
Elizarraras Gerardo and Elizarraras Marsa
Home Financials for this Owner
Home Financials are based on the most recent Mortgage that was taken out on this home.
Original Mortgage
$198,900
Interest Rate
7.21%
Create a Home Valuation Report for This Property
The Home Valuation Report is an in-depth analysis detailing your home's value as well as a comparison with similar homes in the area
Home Values in the Area
Average Home Value in this Area
Purchase History
| Date | Buyer | Sale Price | Title Company |
|---|---|---|---|
| Elizarraras Gerardo | -- | Fidelity National Title | |
| Elizarraras Gerardo | $221,000 | Landsafe Title | |
| Lopez Sergio Filiberto | -- | Landsafe Title |
Source: Public Records
Mortgage History
| Date | Status | Borrower | Loan Amount |
|---|---|---|---|
| Open | Elizarraras Gerardo | $238,000 | |
| Previous Owner | Elizarraras Gerardo | $198,900 | |
| Closed | Elizarraras Gerardo | $6,630 |
Source: Public Records
Tax History Compared to Growth
Tax History
| Year | Tax Paid | Tax Assessment Tax Assessment Total Assessment is a certain percentage of the fair market value that is determined by local assessors to be the total taxable value of land and additions on the property. | Land | Improvement |
|---|---|---|---|---|
| 2025 | $4,385 | $374,943 | $245,550 | $129,393 |
| 2024 | $4,385 | $367,592 | $240,736 | $126,856 |
| 2023 | $4,284 | $360,385 | $236,016 | $124,369 |
| 2022 | $4,238 | $353,319 | $231,388 | $121,931 |
| 2021 | $4,170 | $346,392 | $226,851 | $119,541 |
| 2020 | $4,131 | $342,841 | $224,525 | $118,316 |
| 2019 | $4,019 | $336,119 | $220,122 | $115,997 |
| 2018 | $3,952 | $329,529 | $215,806 | $113,723 |
| 2017 | $3,882 | $323,068 | $211,574 | $111,494 |
| 2016 | $3,791 | $316,734 | $207,426 | $109,308 |
| 2015 | $3,684 | $311,977 | $204,310 | $107,667 |
| 2014 | $3,575 | $305,866 | $200,308 | $105,558 |
Source: Public Records
Map
Nearby Homes
- 1400 Eastpark Dr
- 1042 E La Habra Blvd Unit 233
- 1018 E La Habra Blvd Unit 238
- 976 E La Habra Blvd Unit 115
- 994 E La Habra Blvd Unit 246
- 308 S Valencia St
- 1682 Ironwood Ct
- 1663 Gatewood Ct
- 2211 Frantz Ave
- 1508 Mccart Ave
- 598 Elkwood Ct
- 2121 Lake Side Dr Unit 158
- 1506 Bergman Ct
- 2010 Madonna Ln
- 1731 Brookfield Ave
- 1414 W Central Ave Unit 88
- 620 Lake Ridge Way Unit 45
- 2201 Lake View Dr Unit 20
- 551 Lake Grove Way Unit 165
- 570 E 2nd Ave
- 311 N Fonda St
- 300 N Dexter St
- 321 N Fonda St
- 310 N Dexter St
- 1520 E Stearns Ave
- 1500 E Stearns Ave
- 300 N Fonda St
- 320 N Dexter St
- 310 N Fonda St
- 331 N Fonda St
- 1440 E Stearns Ave
- 320 N Fonda St
- 330 N Dexter St
- 1521 Eastpark Dr
- 1501 Eastpark Dr
- 330 N Fonda St
- 341 N Fonda St
- 1420 E Stearns Ave
- 301 Vallejo St
- 340 N Dexter St