Estimated Value: $139,000 - $165,000
2
Beds
2
Baths
1,014
Sq Ft
$152/Sq Ft
Est. Value
About This Home
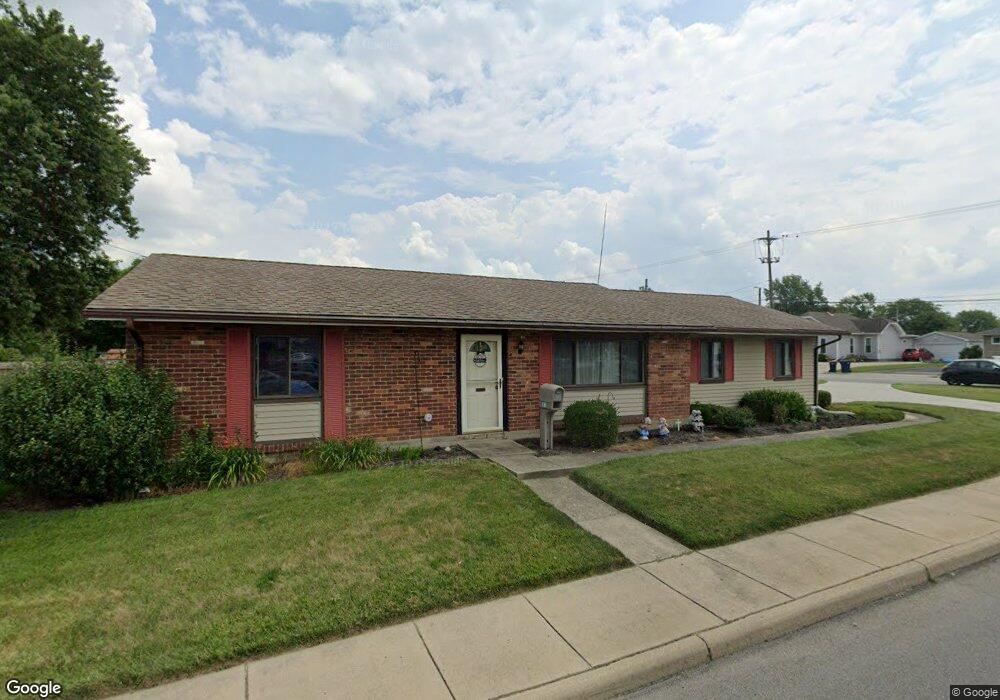
This home is located at 301 N Sunset Dr, Piqua, OH 45356 and is currently estimated at $154,458, approximately $152 per square foot. 301 N Sunset Dr is a home located in Miami County with nearby schools including Washington Primary School, Piqua Junior High School, and Piqua High School.
Ownership History
Date
Name
Owned For
Owner Type
Purchase Details
Closed on
Sep 16, 2025
Sold by
Poling Mary S
Bought by
Cavender Lisa and Cavender Brian
Current Estimated Value
Home Financials for this Owner
Home Financials are based on the most recent Mortgage that was taken out on this home.
Original Mortgage
$76,000
Outstanding Balance
$76,000
Interest Rate
6.63%
Mortgage Type
New Conventional
Estimated Equity
$78,458
Purchase Details
Closed on
Jun 1, 2005
Sold by
Covington Investments Llc
Bought by
Poling Donald and Poling Mary S
Home Financials for this Owner
Home Financials are based on the most recent Mortgage that was taken out on this home.
Original Mortgage
$76,500
Interest Rate
5.91%
Mortgage Type
New Conventional
Purchase Details
Closed on
Jul 25, 2002
Sold by
Hud
Bought by
Covington Investments Llc
Purchase Details
Closed on
Mar 11, 2002
Sold by
Andress Douglas L
Bought by
Hud
Purchase Details
Closed on
Jul 6, 1994
Sold by
Est Helen Marshall
Bought by
Barrett Norman B and Barrett Joyce E
Create a Home Valuation Report for This Property
The Home Valuation Report is an in-depth analysis detailing your home's value as well as a comparison with similar homes in the area
Home Values in the Area
Average Home Value in this Area
Purchase History
| Date | Buyer | Sale Price | Title Company |
|---|---|---|---|
| Cavender Lisa | $95,000 | Northwest Title | |
| Poling Donald | $75,000 | -- | |
| Covington Investments Llc | -- | -- | |
| Hud | -- | -- | |
| Barrett Norman B | $58,500 | -- |
Source: Public Records
Mortgage History
| Date | Status | Borrower | Loan Amount |
|---|---|---|---|
| Open | Cavender Lisa | $76,000 | |
| Previous Owner | Hud | $76,500 |
Source: Public Records
Tax History Compared to Growth
Tax History
| Year | Tax Paid | Tax Assessment Tax Assessment Total Assessment is a certain percentage of the fair market value that is determined by local assessors to be the total taxable value of land and additions on the property. | Land | Improvement |
|---|---|---|---|---|
| 2024 | $893 | $31,540 | $5,920 | $25,620 |
| 2023 | $893 | $31,540 | $5,920 | $25,620 |
| 2022 | $953 | $31,540 | $5,920 | $25,620 |
| 2021 | $667 | $23,350 | $4,380 | $18,970 |
| 2020 | $654 | $23,350 | $4,380 | $18,970 |
| 2019 | $658 | $23,350 | $4,380 | $18,970 |
| 2018 | $540 | $20,200 | $4,380 | $15,820 |
| 2017 | $547 | $20,200 | $4,380 | $15,820 |
| 2016 | $541 | $20,200 | $4,380 | $15,820 |
| 2015 | $553 | $20,200 | $4,380 | $15,820 |
| 2014 | $553 | $20,200 | $4,380 | $15,820 |
| 2013 | $555 | $20,200 | $4,380 | $15,820 |
Source: Public Records
Map
Nearby Homes