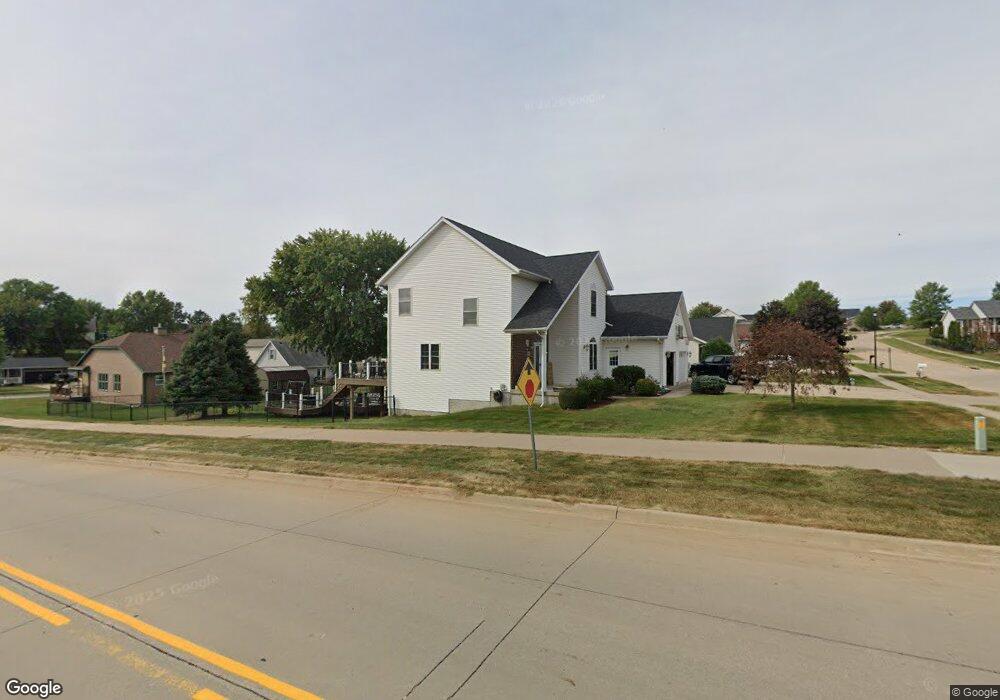
301 Nightingale Dr Tiffin, IA 52340
Estimated Value: $370,000 - $479,000
3
Beds
3
Baths
2,137
Sq Ft
$193/Sq Ft
Est. Value
About This Home
This home is located at 301 Nightingale Dr, Tiffin, IA 52340 and is currently estimated at $411,622, approximately $192 per square foot. 301 Nightingale Dr is a home located in Johnson County with nearby schools including Clear Creek Amana High School.
Ownership History
Date
Name
Owned For
Owner Type
Purchase Details
Closed on
Aug 5, 2010
Sold by
The Secretary Of Veterans Affairs
Bought by
Liebe David E and Liebe Julie K
Current Estimated Value
Home Financials for this Owner
Home Financials are based on the most recent Mortgage that was taken out on this home.
Original Mortgage
$153,600
Outstanding Balance
$101,455
Interest Rate
4.6%
Mortgage Type
New Conventional
Estimated Equity
$310,167
Purchase Details
Closed on
Feb 17, 2010
Sold by
Wells Fargo Bank Na
Bought by
Secretary Of Veterans Affairs
Purchase Details
Closed on
Feb 5, 2010
Sold by
Kolarik Douglas Charles
Bought by
Wells Fargo Bank Na
Purchase Details
Closed on
Dec 26, 2006
Sold by
Us Bank Na
Bought by
Kolarik Douglas C
Home Financials for this Owner
Home Financials are based on the most recent Mortgage that was taken out on this home.
Original Mortgage
$192,000
Interest Rate
6.24%
Mortgage Type
VA
Purchase Details
Closed on
Jul 14, 2006
Sold by
Hovey Mark
Bought by
Us Bank Na
Create a Home Valuation Report for This Property
The Home Valuation Report is an in-depth analysis detailing your home's value as well as a comparison with similar homes in the area
Home Values in the Area
Average Home Value in this Area
Purchase History
| Date | Buyer | Sale Price | Title Company |
|---|---|---|---|
| Liebe David E | -- | None Available | |
| Secretary Of Veterans Affairs | $185,500 | None Available | |
| Wells Fargo Bank Na | $185,073 | None Available | |
| Kolarik Douglas C | $192,000 | None Available | |
| Us Bank Na | $211,500 | None Available |
Source: Public Records
Mortgage History
| Date | Status | Borrower | Loan Amount |
|---|---|---|---|
| Open | Liebe David E | $153,600 | |
| Previous Owner | Kolarik Douglas C | $192,000 |
Source: Public Records
Tax History Compared to Growth
Tax History
| Year | Tax Paid | Tax Assessment Tax Assessment Total Assessment is a certain percentage of the fair market value that is determined by local assessors to be the total taxable value of land and additions on the property. | Land | Improvement |
|---|---|---|---|---|
| 2025 | $6,918 | $410,000 | $61,700 | $348,300 |
| 2024 | $6,698 | $400,500 | $61,700 | $338,800 |
| 2023 | $6,528 | $400,500 | $61,700 | $338,800 |
| 2022 | $6,456 | $334,000 | $44,100 | $289,900 |
| 2021 | $6,442 | $334,000 | $44,100 | $289,900 |
| 2020 | $6,442 | $318,800 | $44,100 | $274,700 |
| 2019 | $6,454 | $318,800 | $44,100 | $274,700 |
| 2018 | $6,316 | $318,800 | $44,100 | $274,700 |
| 2017 | $6,098 | $318,800 | $44,100 | $274,700 |
| 2016 | $5,928 | $297,600 | $44,100 | $253,500 |
| 2015 | $5,928 | $297,600 | $44,100 | $253,500 |
| 2014 | $4,564 | $236,400 | $34,000 | $202,400 |
Source: Public Records
Map
Nearby Homes
- 289 Hickory Ct Unit B
- 282 Hickory Ct
- 440 Roberts Ferry Rd
- 228 Cherry Ln
- 8 Pinnacle Ln
- 637 Catherine Dr
- 633 Catherine Dr
- 612 Doe Ave
- 515 Potter St Unit 2
- 605 Doe Ave
- 602 Dakota Ave
- 608 Maddie Ln
- 432 Rolling Hills Dr
- 463 Potter St
- 534 Iris Ave
- 530 Iris Ave
- 521 E Goldfinch Dr
- 536 Bear Dr
- 203 Edelweiss Cir
- 814 N Croell Ave
- 305 Nightingale Dr
- 0 Roberts Ferry Rd
- 302 W Goldfinch Dr
- 304 Nightingale Dr
- 308 W Goldfinch Dr
- 309 Nightingale Dr
- 610 Roberts Ferry Rd
- 312 W Goldfinch Dr
- 284 W Goldfinch Dr
- 313 Nightingale Dr
- 1702 Croell Ave
- 706 Blue Jay Ct
- 705 Blue Jay Ct
- 318 W Goldfinch Dr
- 282 W Goldfinch Dr
- 303 W Goldfinch Dr
- 307 W Goldfinch Dr
- 709 Blue Jay Ct
- 710 Blue Jay Ct
- 311 W Goldfinch Dr