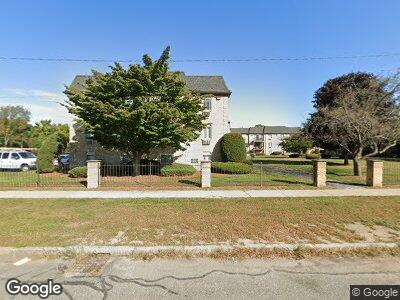
301 Pawtucket Blvd Unit 2 Lowell, MA 01854
Pawtucketville NeighborhoodEstimated Value: $260,000 - $286,000
2
Beds
1
Bath
868
Sq Ft
$311/Sq Ft
Est. Value
About This Home
This home is located at 301 Pawtucket Blvd Unit 2, Lowell, MA 01854 and is currently estimated at $269,583, approximately $310 per square foot. 301 Pawtucket Blvd Unit 2 is a home located in Middlesex County with nearby schools including Joseph McAvinnue Elementary School, Charlotte M Murkland Elementary School, and Charles W. Morey Elementary School.
Ownership History
Date
Name
Owned For
Owner Type
Purchase Details
Closed on
Dec 27, 2024
Sold by
Santiago Angela M
Bought by
Santiago 2024 Irt and Morgan
Current Estimated Value
Purchase Details
Closed on
Jun 3, 2005
Sold by
Cepeda Vargas Ubaldo
Bought by
Santiago Angela M and Santiago Gilberto
Home Financials for this Owner
Home Financials are based on the most recent Mortgage that was taken out on this home.
Original Mortgage
$120,275
Interest Rate
5.83%
Mortgage Type
Purchase Money Mortgage
Purchase Details
Closed on
Jun 9, 1987
Sold by
Camelot Ct Rlty Co
Bought by
Vargas Ubaldo Cepeda
Home Financials for this Owner
Home Financials are based on the most recent Mortgage that was taken out on this home.
Original Mortgage
$63,900
Interest Rate
10.38%
Mortgage Type
Purchase Money Mortgage
Create a Home Valuation Report for This Property
The Home Valuation Report is an in-depth analysis detailing your home's value as well as a comparison with similar homes in the area
Home Values in the Area
Average Home Value in this Area
Purchase History
| Date | Buyer | Sale Price | Title Company |
|---|---|---|---|
| Santiago 2024 Irt | -- | None Available | |
| Santiago Angela M | $141,500 | -- | |
| Vargas Ubaldo Cepeda | $79,900 | -- |
Source: Public Records
Mortgage History
| Date | Status | Borrower | Loan Amount |
|---|---|---|---|
| Previous Owner | Santiago Angela M | $120,275 | |
| Previous Owner | Vargas Ubaldo Cepeda | $63,900 |
Source: Public Records
Tax History Compared to Growth
Tax History
| Year | Tax Paid | Tax Assessment Tax Assessment Total Assessment is a certain percentage of the fair market value that is determined by local assessors to be the total taxable value of land and additions on the property. | Land | Improvement |
|---|---|---|---|---|
| 2025 | $2,524 | $219,900 | $0 | $219,900 |
| 2024 | $2,461 | $206,600 | $0 | $206,600 |
| 2023 | $2,260 | $182,000 | $0 | $182,000 |
| 2022 | $2,143 | $168,900 | $0 | $168,900 |
| 2021 | $2,031 | $150,900 | $0 | $150,900 |
| 2020 | $1,849 | $138,400 | $0 | $138,400 |
| 2019 | $1,801 | $128,300 | $0 | $128,300 |
| 2018 | $1,628 | $113,100 | $0 | $113,100 |
| 2017 | $1,467 | $98,300 | $0 | $98,300 |
| 2016 | $1,260 | $83,100 | $0 | $83,100 |
| 2015 | $1,221 | $78,900 | $0 | $78,900 |
| 2013 | $1,087 | $72,400 | $0 | $72,400 |
Source: Public Records
Map
Nearby Homes
- 293 Pawtucket Blvd Unit 3
- 309 Pawtucket Blvd Unit 20
- 311 Pawtucket Blvd Unit 27
- 345 Pawtucket Blvd Unit 7
- 1311 Middlesex St
- 527 Pawtucket Blvd Unit 503
- 11 Rule Ln
- 30 Caleb St
- 228 Varnum Ave
- 53 Joffre St
- 134 Lexington Ave
- 20 Meadow Dr
- 106 Sayles St
- 179 Varnum Ave Unit 2
- 97 Livingston Ave
- 4 Tamarack St
- 1117 Middlesex St
- 136 Chase Ave
- 522 Pine St
- 67 Halley Rd
- 301 Pawtucket Blvd Unit 3
- 301 Pawtucket Blvd Unit 9
- 301 Pawtucket Blvd Unit 1
- 301 Pawtucket Blvd Unit 17
- 301 Pawtucket Blvd Unit 12
- 301 Pawtucket Blvd Unit 20
- 301 Pawtucket Blvd Unit 19
- 301 Pawtucket Blvd Unit 18
- 301 Pawtucket Blvd Unit 11
- 301 Pawtucket Blvd Unit 10
- 301 Pawtucket Blvd Unit 4
- 301 Pawtucket Blvd Unit 2
- 301 Pawtucket Blvd Unit 17,301
- 301 Pawtucket Blvd Unit 9 301
- 301 Pawtucket Blvd Unit 12,301
- 303 Pawtucket Blvd Unit 16
- 303 Pawtucket Blvd Unit 21
- 303 Pawtucket Blvd Unit 6
- 303 Pawtucket Blvd Unit 24
- 303 Pawtucket Blvd Unit 5