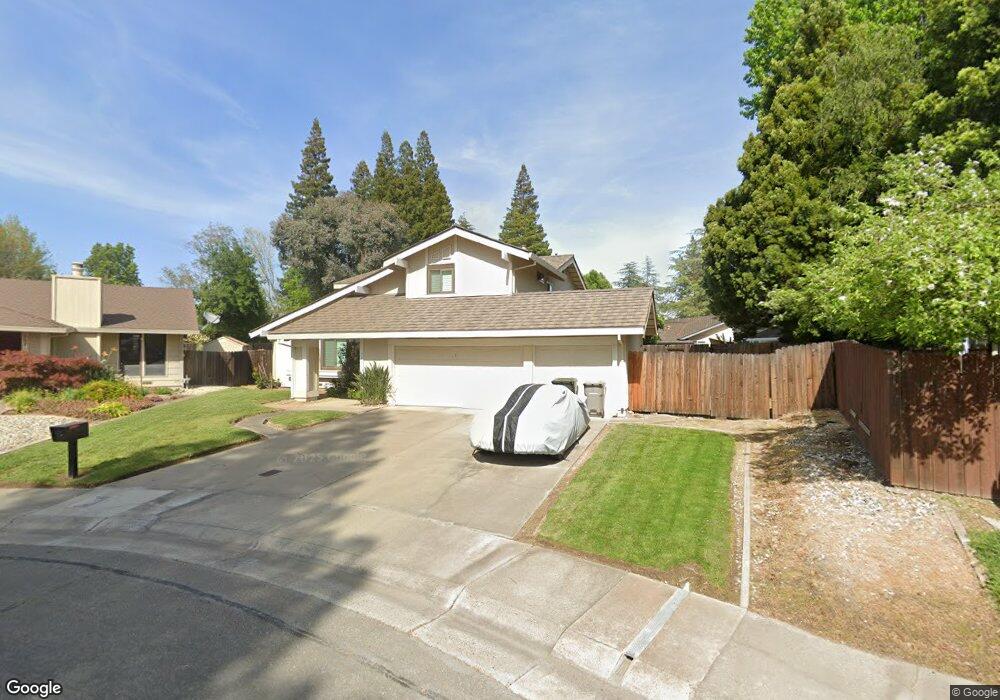
301 Rivertree Way Sacramento, CA 95831
Pocket-Greenhaven NeighborhoodEstimated Value: $754,953 - $792,000
4
Beds
3
Baths
2,517
Sq Ft
$307/Sq Ft
Est. Value
About This Home
This home is located at 301 Rivertree Way, Sacramento, CA 95831 and is currently estimated at $772,738, approximately $307 per square foot. 301 Rivertree Way is a home located in Sacramento County with nearby schools including Genevieve Didion School, Sam Brannan Middle School, and John F. Kennedy High School.
Ownership History
Date
Name
Owned For
Owner Type
Purchase Details
Closed on
Jun 13, 2017
Sold by
Mar Weldon Y and Mar Eveline W
Bought by
Mar Weldon Y and Mar Eveline W
Current Estimated Value
Home Financials for this Owner
Home Financials are based on the most recent Mortgage that was taken out on this home.
Original Mortgage
$120,000
Interest Rate
4.02%
Mortgage Type
Credit Line Revolving
Purchase Details
Closed on
Sep 5, 2013
Sold by
Mar Weldon Y and Mar Eveline W
Bought by
Mar Weldon Y and Mar Eveline W
Home Financials for this Owner
Home Financials are based on the most recent Mortgage that was taken out on this home.
Original Mortgage
$250,000
Interest Rate
4.27%
Mortgage Type
New Conventional
Purchase Details
Closed on
Aug 30, 2010
Sold by
Wong Mar Weldon Y and Wong Mar Eveline
Bought by
Mar Weldon Y and Mar Eveline W
Create a Home Valuation Report for This Property
The Home Valuation Report is an in-depth analysis detailing your home's value as well as a comparison with similar homes in the area
Home Values in the Area
Average Home Value in this Area
Purchase History
| Date | Buyer | Sale Price | Title Company |
|---|---|---|---|
| Mar Weldon Y | -- | Placer Title Company | |
| Mar Weldon Y | -- | Placer Title Company | |
| Mar Weldon Y | -- | Stewart Title Sacramento | |
| Mar Weldon Y | -- | Stewart Title Of Sacramento | |
| Mar Weldon Y | -- | None Available |
Source: Public Records
Mortgage History
| Date | Status | Borrower | Loan Amount |
|---|---|---|---|
| Closed | Mar Weldon Y | $120,000 | |
| Closed | Mar Weldon Y | $250,000 |
Source: Public Records
Tax History Compared to Growth
Tax History
| Year | Tax Paid | Tax Assessment Tax Assessment Total Assessment is a certain percentage of the fair market value that is determined by local assessors to be the total taxable value of land and additions on the property. | Land | Improvement |
|---|---|---|---|---|
| 2025 | $4,849 | $395,146 | $168,254 | $226,892 |
| 2024 | $4,849 | $387,399 | $164,955 | $222,444 |
| 2023 | $4,729 | $379,804 | $161,721 | $218,083 |
| 2022 | $4,663 | $372,357 | $158,550 | $213,807 |
| 2021 | $4,441 | $365,057 | $155,442 | $209,615 |
| 2020 | $4,469 | $361,315 | $153,849 | $207,466 |
| 2019 | $4,375 | $354,232 | $150,833 | $203,399 |
| 2018 | $4,262 | $347,287 | $147,876 | $199,411 |
| 2017 | $4,200 | $340,478 | $144,977 | $195,501 |
| 2016 | $8,772 | $333,803 | $142,135 | $191,668 |
| 2015 | $4,036 | $328,789 | $140,000 | $188,789 |
| 2014 | $3,938 | $322,349 | $137,258 | $185,091 |
Source: Public Records
Map
Nearby Homes
- 0 Riverside Blvd
- 7074 Lazy River Way
- 9 Sandhill Ct
- 5 Dumfries Ct
- 6730 Park Riviera Way
- 6810 Arabella Way
- 487 Twin River Way
- 506 Roundtree Ct
- 625 Valim Way
- 420 Seagull Way
- 14 Westlite Ct
- 462 de Mar Dr
- 7441 Spicewood Dr
- 4 Marina Blue Ct
- 657 Brickyard Dr
- 792 Parklin Ave
- 6235 Allenport Way
- 7455 Summerwind Way
- 7791 Park River Oak Cir
- 7716 George River Ln
- 297 Rivertree Way
- 7010 Riverside Blvd
- 7000 Riverside Blvd
- 305 Rivertree Way
- 5 Kingbird Ct
- 293 Rivertree Way
- 6990 Riverside Blvd
- 7020 Riverside Blvd
- 6875 Claiborne Way
- 10 Kingbird Ct
- 294 Rivertree Way
- 300 Brewster Ave
- 302 Rivertree Way
- 304 Brewster Ave
- 289 Rivertree Way
- 6865 Claiborne Way
- 6980 Riverside Blvd
- 310 Rivertree Way
- 306 Rivertree Way
- 6 Kingbird Ct