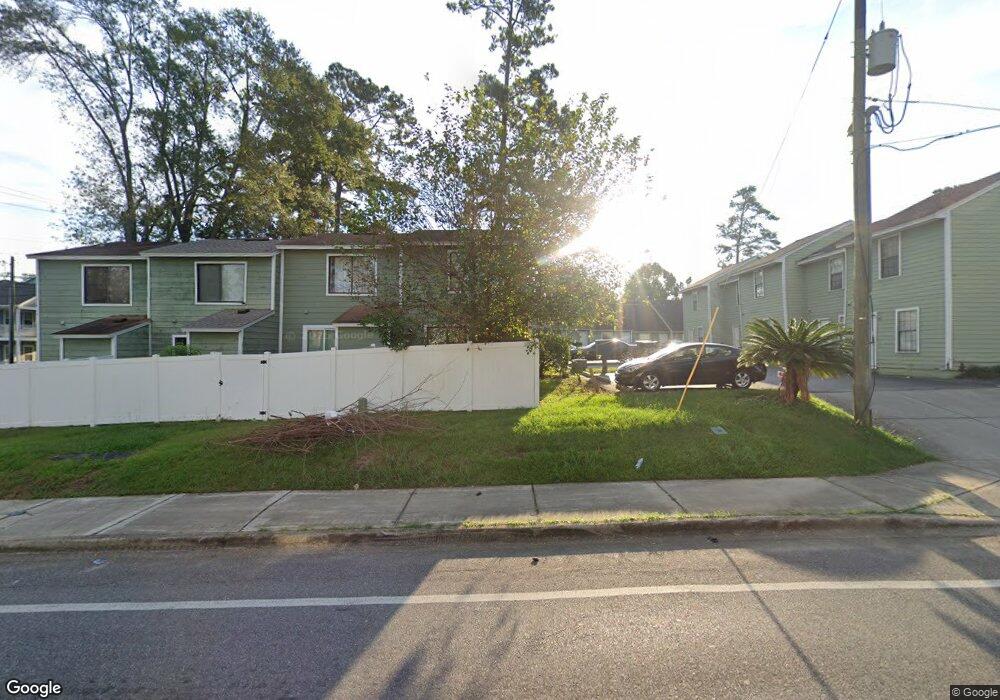
301 S Lipona Rd Unit 2C Tallahassee, FL 32304
University NeighborhoodEstimated Value: $146,000 - $178,000
2
Beds
2
Baths
896
Sq Ft
$177/Sq Ft
Est. Value
About This Home
This home is located at 301 S Lipona Rd Unit 2C, Tallahassee, FL 32304 and is currently estimated at $158,738, approximately $177 per square foot. 301 S Lipona Rd Unit 2C is a home located in Leon County with nearby schools including John G Riley Elementary School, R. Frank Nims Middle School, and Amos P. Godby High School.
Ownership History
Date
Name
Owned For
Owner Type
Purchase Details
Closed on
Oct 23, 2008
Sold by
Wade Aaron T
Bought by
Starkenburg Justin Michael and Rivera Francisco L
Current Estimated Value
Home Financials for this Owner
Home Financials are based on the most recent Mortgage that was taken out on this home.
Original Mortgage
$77,861
Outstanding Balance
$50,974
Interest Rate
6.11%
Mortgage Type
FHA
Estimated Equity
$107,764
Purchase Details
Closed on
Jul 15, 2003
Sold by
Drake Jeff H and Nelson Mark S
Bought by
Wade Aaron T
Home Financials for this Owner
Home Financials are based on the most recent Mortgage that was taken out on this home.
Original Mortgage
$64,505
Interest Rate
5.16%
Purchase Details
Closed on
Aug 1, 1998
Sold by
Chella Chandraleka
Bought by
Drake Jeff H and Nelson Mark S
Home Financials for this Owner
Home Financials are based on the most recent Mortgage that was taken out on this home.
Original Mortgage
$35,100
Interest Rate
6.97%
Create a Home Valuation Report for This Property
The Home Valuation Report is an in-depth analysis detailing your home's value as well as a comparison with similar homes in the area
Home Values in the Area
Average Home Value in this Area
Purchase History
| Date | Buyer | Sale Price | Title Company |
|---|---|---|---|
| Starkenburg Justin Michael | $92,900 | Attorney | |
| Wade Aaron T | -- | -- | |
| Wade Aaron T | $66,500 | -- | |
| Drake Jeff H | $39,000 | -- |
Source: Public Records
Mortgage History
| Date | Status | Borrower | Loan Amount |
|---|---|---|---|
| Open | Starkenburg Justin Michael | $77,861 | |
| Previous Owner | Wade Aaron T | $64,505 | |
| Previous Owner | Drake Jeff H | $35,100 |
Source: Public Records
Tax History Compared to Growth
Tax History
| Year | Tax Paid | Tax Assessment Tax Assessment Total Assessment is a certain percentage of the fair market value that is determined by local assessors to be the total taxable value of land and additions on the property. | Land | Improvement |
|---|---|---|---|---|
| 2024 | $1,991 | $111,183 | $20,000 | $91,183 |
| 2023 | $1,839 | $91,375 | $0 | $0 |
| 2022 | $1,612 | $92,495 | $15,000 | $77,495 |
| 2021 | $1,450 | $75,516 | $12,000 | $63,516 |
| 2020 | $1,346 | $71,175 | $12,000 | $59,175 |
| 2019 | $1,250 | $65,418 | $12,000 | $53,418 |
| 2018 | $1,204 | $62,409 | $12,000 | $50,409 |
| 2017 | $1,179 | $60,391 | $0 | $0 |
| 2016 | $1,239 | $62,562 | $0 | $0 |
| 2015 | $558 | $58,469 | $0 | $0 |
| 2014 | $558 | $58,005 | $0 | $0 |
Source: Public Records
Map
Nearby Homes
- 2026 Desiree Ct
- 2029 & 2033 Desiree Ct
- 2046 and 2052 Bellevue Way
- 1824 Tyndall Dr
- 315 Meadowbrook Ln
- 319 Meadowbrook Ln
- 2112 Cambridge Dr
- 2006 Karen Ln
- 1737 Atkamire Dr
- 924 S Lipona Rd
- 2127 Oxford Rd
- 2131 Oxford Rd
- 1751 Pepper Dr
- 2306 Oxford Rd
- 2314 Oxford Rd
- 1649 Mayhew St
- 202 Valencia Dr
- 123 Columbia Dr
- 1642 Hernando Dr
- 217 Columbia Dr
- 301 S Lipona Rd Unit 15
- 301 S Lipona Rd Unit 2-A
- 301 S Lipona Rd Unit 24
- 301 S Lipona Rd Unit STE 22
- 301 S Lipona Rd Unit 14
- 301 S Lipona Rd Unit 13
- 301 S Lipona Rd Unit 8
- 301 S Lipona Rd Unit STE 28
- 301 S Lipona Rd Unit 25
- 301 S Lipona Rd Unit 11
- 301 S Lipona Rd Unit 10
- 301 S Lipona Rd
- 301 S Lipona Rd
- 301 S Lipona Rd
- 301 S Lipona Rd
- 301 S Lipona Rd
- 301 S Lipona Rd Unit 1D
- 301 S Lipona Rd
- 301 S Lipona Rd Unit 27
- 301 S Lipona Rd Unit 16