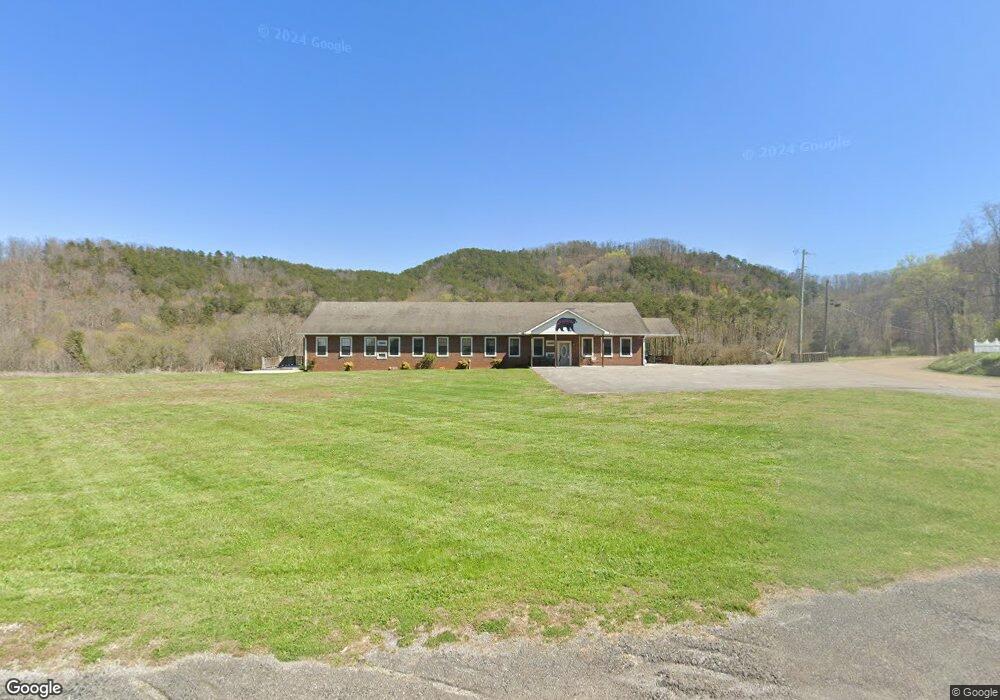
301 School St Tellico Plains, TN 37385
Estimated Value: $440,000 - $567,000
2
Beds
3
Baths
3,600
Sq Ft
$134/Sq Ft
Est. Value
About This Home
This home is located at 301 School St, Tellico Plains, TN 37385 and is currently estimated at $483,037, approximately $134 per square foot. 301 School St is a home located in Monroe County with nearby schools including Tellico Plains Elementary School, Tellico Plains Junior High School, and Tellico Plains High School.
Ownership History
Date
Name
Owned For
Owner Type
Purchase Details
Closed on
Jan 28, 2025
Sold by
Vsm Properties Llc
Bought by
Tellico Rentals Llc
Current Estimated Value
Purchase Details
Closed on
Apr 21, 2015
Sold by
Peoples Bank Of East Tennessee
Bought by
Saunders Mary Jane
Purchase Details
Closed on
Apr 7, 2014
Bought by
Saunders Mary Jane
Purchase Details
Closed on
Sep 11, 2012
Sold by
Hamilton & Sons Llc
Bought by
Peoples Bank Of East Tennessee
Purchase Details
Closed on
May 28, 2010
Sold by
Peoples Bank Of East Tenne
Bought by
Hamilton
Purchase Details
Closed on
Jul 18, 2007
Sold by
Bald River Log Homes Inc
Bought by
Tony Papa
Purchase Details
Closed on
Dec 27, 2005
Sold by
Schoolhouse Of Tellico Pla
Bought by
Boulder Investment
Purchase Details
Closed on
Mar 18, 2005
Sold by
Heirs Bookout Dave
Bought by
Douglass Bookout Harless
Create a Home Valuation Report for This Property
The Home Valuation Report is an in-depth analysis detailing your home's value as well as a comparison with similar homes in the area
Home Values in the Area
Average Home Value in this Area
Purchase History
| Date | Buyer | Sale Price | Title Company |
|---|---|---|---|
| Tellico Rentals Llc | -- | Crossland Title | |
| Saunders Mary Jane | $200,000 | -- | |
| Saunders Mary Jane | $200,000 | -- | |
| Peoples Bank Of East Tennessee | $303,000 | -- | |
| Hamilton | $275,000 | -- | |
| Tony Papa | $30,000 | -- | |
| Boulder Investment | $200,000 | -- | |
| Douglass Bookout Harless | -- | -- |
Source: Public Records
Tax History Compared to Growth
Tax History
| Year | Tax Paid | Tax Assessment Tax Assessment Total Assessment is a certain percentage of the fair market value that is determined by local assessors to be the total taxable value of land and additions on the property. | Land | Improvement |
|---|---|---|---|---|
| 2025 | -- | $184,040 | $0 | $0 |
| 2024 | $2,120 | $184,040 | $7,360 | $176,680 |
| 2023 | $2,120 | $113,500 | $4,600 | $108,900 |
| 2022 | $1,842 | $68,700 | $3,400 | $65,300 |
| 2021 | $1,842 | $68,700 | $3,400 | $65,300 |
| 2020 | $1,842 | $68,700 | $3,400 | $65,300 |
| 2019 | $1,663 | $68,700 | $3,400 | $65,300 |
| 2018 | $1,663 | $68,700 | $3,400 | $65,300 |
| 2017 | $1,607 | $62,725 | $2,000 | $60,725 |
| 2016 | $1,939 | $75,675 | $2,000 | $73,675 |
| 2015 | $1,939 | $75,675 | $2,000 | $73,675 |
| 2014 | $1,939 | $75,671 | $0 | $0 |
Source: Public Records
Map
Nearby Homes
- 217 Loomis St
- 207 Loomis St
- 111 Bryan Hill Dr
- 410 Scott St
- 903 Veterans Memorial Dr
- 115 Willowbrook Dr
- 2 Cherohala Skyway
- 0 Carringer Cir
- 390 Cherohala Skyway
- 104 Hereford St
- 0 Highway 68 Unit 1316530
- 0 Highway 68 Unit 24267548
- 0 Highway 68 Unit 1316540
- 6915 Tennessee 360
- 0 Lake Heights Rd Unit 1310060
- 135 H & H Rd
- 57.09 acs Rafter Rd
- 0 Unicoi Church Rd
- 173 Rafter Rd
- 179 Rafter Rd
- 124 Harrison St
- 498 Harrison St
- 108 Willow St
- 186 School St
- 111 Willow St
- 312 Loomis St
- 312 Loomis St
- 320 School St
- Lot 1 School St
- 113 Willow St
- 000 School St
- 0 School St
- 0 Loomis St Unit 2090-L
- 124 Willow St
- 405 Spence St
- 121 Willow St
- 145 Willowbrook Dr
- 315 Southard St
- Lot 27 Willowbrook Dr
- 417 Loomis St