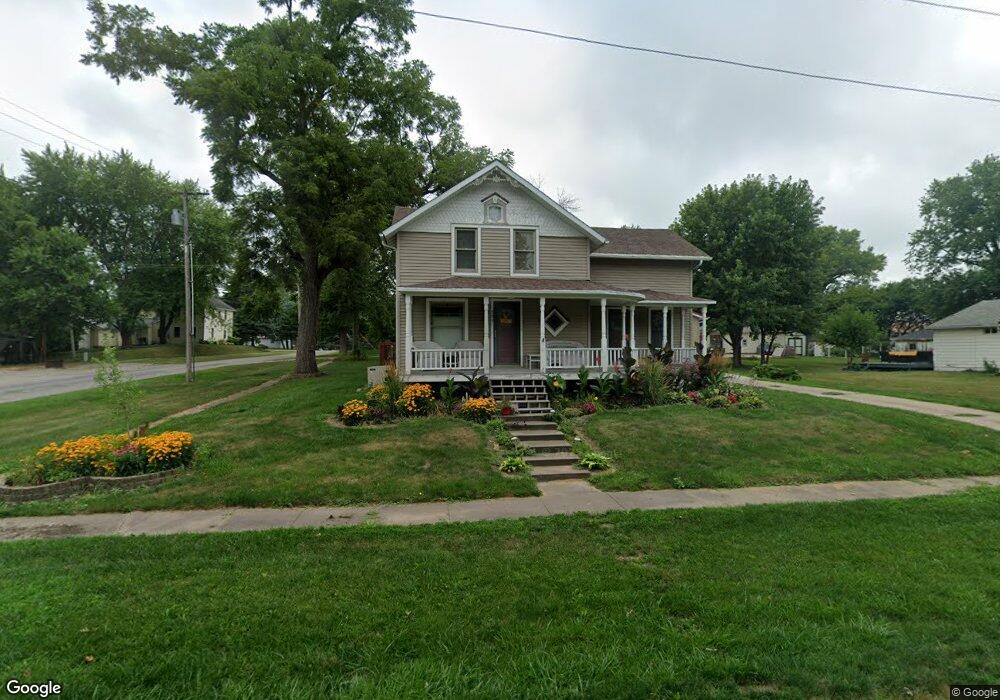
301 Short St Nichols, IA 52766
Estimated Value: $220,000 - $276,000
4
Beds
3
Baths
2,208
Sq Ft
$115/Sq Ft
Est. Value
About This Home
This home is located at 301 Short St, Nichols, IA 52766 and is currently estimated at $254,253, approximately $115 per square foot. 301 Short St is a home located in Muscatine County with nearby schools including Early Childhood Center, West Liberty Middle School, and West Liberty High School.
Ownership History
Date
Name
Owned For
Owner Type
Purchase Details
Closed on
Feb 22, 2013
Sold by
Kirchner Andrew Kyle
Bought by
Kirchner Kelsie J
Current Estimated Value
Purchase Details
Closed on
Apr 1, 2010
Sold by
Howes Russell F and Howes Cheryl L
Bought by
Kirchner Kelsie J
Home Financials for this Owner
Home Financials are based on the most recent Mortgage that was taken out on this home.
Original Mortgage
$164,466
Outstanding Balance
$108,896
Interest Rate
4.96%
Mortgage Type
FHA
Estimated Equity
$145,357
Purchase Details
Closed on
Oct 25, 2005
Sold by
Foster Cletus R and Foster Michelle R
Bought by
Wattenbarger Brian C and Rahmus Tamara M
Home Financials for this Owner
Home Financials are based on the most recent Mortgage that was taken out on this home.
Original Mortgage
$121,600
Interest Rate
6.3%
Mortgage Type
New Conventional
Create a Home Valuation Report for This Property
The Home Valuation Report is an in-depth analysis detailing your home's value as well as a comparison with similar homes in the area
Home Values in the Area
Average Home Value in this Area
Purchase History
| Date | Buyer | Sale Price | Title Company |
|---|---|---|---|
| Kirchner Kelsie J | -- | None Available | |
| Kirchner Kelsie J | $167,500 | None Available | |
| Wattenbarger Brian C | $151,500 | None Available |
Source: Public Records
Mortgage History
| Date | Status | Borrower | Loan Amount |
|---|---|---|---|
| Open | Kirchner Kelsie J | $164,466 | |
| Previous Owner | Wattenbarger Brian C | $121,600 |
Source: Public Records
Tax History Compared to Growth
Tax History
| Year | Tax Paid | Tax Assessment Tax Assessment Total Assessment is a certain percentage of the fair market value that is determined by local assessors to be the total taxable value of land and additions on the property. | Land | Improvement |
|---|---|---|---|---|
| 2025 | $3,651 | $273,360 | $14,540 | $258,820 |
| 2024 | $3,651 | $271,980 | $14,540 | $257,440 |
| 2023 | $11 | $250,033 | $14,501 | $235,532 |
| 2022 | $3,426 | $247,680 | $13,680 | $234,000 |
| 2021 | $3,428 | $214,770 | $13,680 | $201,090 |
| 2020 | $3,119 | $181,990 | $13,680 | $168,310 |
| 2019 | $3,231 | $171,800 | $0 | $0 |
| 2018 | $3,174 | $171,480 | $0 | $0 |
| 2017 | $3,162 | $176,570 | $0 | $0 |
| 2016 | $3,346 | $176,570 | $0 | $0 |
| 2015 | $3,346 | $160,020 | $0 | $0 |
| 2014 | $3,040 | $160,020 | $0 | $0 |
Source: Public Records
Map
Nearby Homes