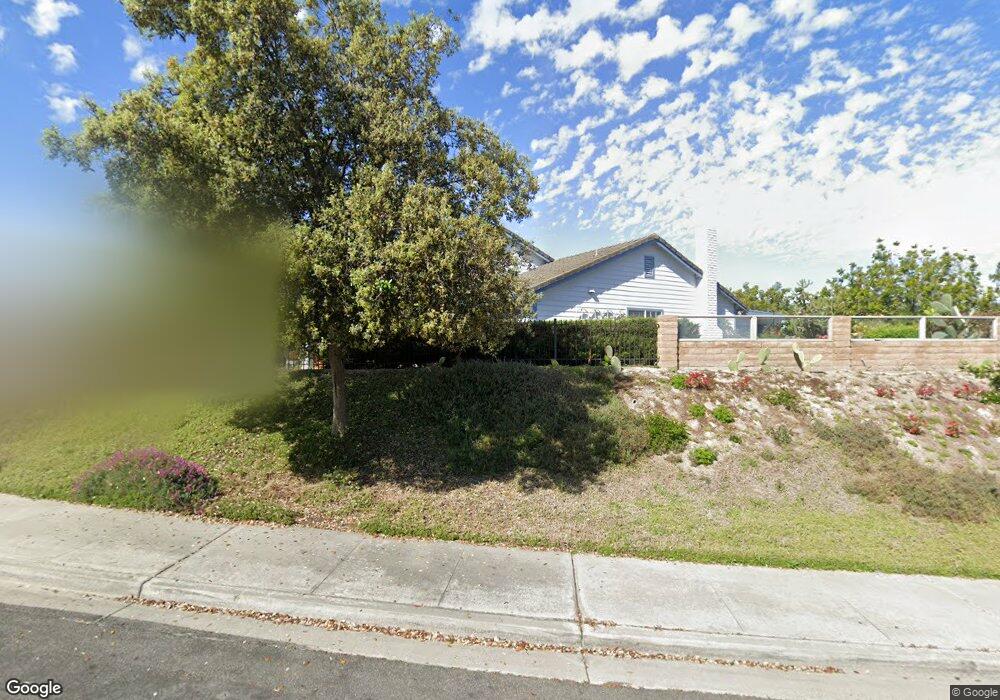
301 Via Metates Oceanside, CA 92057
Guajome NeighborhoodEstimated Value: $823,958 - $846,000
3
Beds
2
Baths
1,364
Sq Ft
$610/Sq Ft
Est. Value
About This Home
This home is located at 301 Via Metates, Oceanside, CA 92057 and is currently estimated at $831,990, approximately $609 per square foot. 301 Via Metates is a home located in San Diego County with nearby schools including Alamosa Park Elementary School, Roosevelt Middle School, and Vista High School.
Ownership History
Date
Name
Owned For
Owner Type
Purchase Details
Closed on
May 29, 2020
Sold by
Mccomb Michael C and Mccomb Nicole B
Bought by
Mccomb Michael C and Mccomb Nicole B
Current Estimated Value
Purchase Details
Closed on
May 28, 1997
Sold by
Link Roscoe & May Del Family Trust
Bought by
Zenzola Joseph A and Zenzola Carmelita
Home Financials for this Owner
Home Financials are based on the most recent Mortgage that was taken out on this home.
Original Mortgage
$151,900
Outstanding Balance
$21,606
Interest Rate
7.91%
Mortgage Type
Purchase Money Mortgage
Estimated Equity
$810,384
Purchase Details
Closed on
Jul 25, 1996
Sold by
Link Roscoe & May Del Family Trust A M
Bought by
Link May Del C
Purchase Details
Closed on
Oct 26, 1988
Create a Home Valuation Report for This Property
The Home Valuation Report is an in-depth analysis detailing your home's value as well as a comparison with similar homes in the area
Home Values in the Area
Average Home Value in this Area
Purchase History
| Date | Buyer | Sale Price | Title Company |
|---|---|---|---|
| Mccomb Michael C | -- | None Available | |
| Zenzola Joseph A | $160,000 | Guardian Title Company | |
| Link May Del C | -- | -- | |
| -- | $149,900 | -- |
Source: Public Records
Mortgage History
| Date | Status | Borrower | Loan Amount |
|---|---|---|---|
| Open | Zenzola Joseph A | $151,900 |
Source: Public Records
Tax History
| Year | Tax Paid | Tax Assessment Tax Assessment Total Assessment is a certain percentage of the fair market value that is determined by local assessors to be the total taxable value of land and additions on the property. | Land | Improvement |
|---|---|---|---|---|
| 2025 | $2,748 | $260,403 | $87,936 | $172,467 |
| 2024 | $2,748 | $255,298 | $86,212 | $169,086 |
| 2023 | $2,681 | $250,293 | $84,522 | $165,771 |
| 2022 | $2,672 | $245,386 | $82,865 | $162,521 |
| 2021 | $2,612 | $240,576 | $81,241 | $159,335 |
| 2020 | $2,602 | $238,110 | $80,408 | $157,702 |
| 2019 | $2,563 | $233,442 | $78,832 | $154,610 |
| 2018 | $2,435 | $228,866 | $77,287 | $151,579 |
| 2017 | $2,389 | $224,379 | $75,772 | $148,607 |
| 2016 | $2,331 | $219,981 | $74,287 | $145,694 |
| 2015 | $2,321 | $216,678 | $73,172 | $143,506 |
| 2014 | $2,263 | $212,434 | $71,739 | $140,695 |
Source: Public Records
Map
Nearby Homes
- 5166 Via Portola
- 209 Madison St
- 5010 Golondrina Way Unit 64
- 254 Saguaro Place
- 5005 Codorniz Way Unit 8
- 166 Mckinley St
- 154 Harrison St
- 4791 Macadamia Ct
- 5108 Andrew Jackson St
- 255 Flame Tree Place
- 761 Masters Dr
- 5462 Mae Way
- 104 Mellano Way
- 652 Montage Rd
- 5462 Giovanni Way
- 4733 Dalea Place
- 119 Takamasa Way
- 110 Takamasa Way
- 5074 Cascade Way Unit 102
- 4743 Maclura St
- 305 Via Metates Unit 1
- 309 Via Metates
- 306 Via Metates
- 302 Via Metates
- 310 Via Metates
- 313 Via Metates
- 314 Via Metates
- 4963 Yuma Ave
- 4959 Yuma Ave
- 317 Via Metates
- 4967 Yuma Ave
- 5102 Via Portola
- 4955 Yuma Ave
- 305 Luiseno Ave Unit 2
- 301 Luiseno Ave
- 309 Luiseno Ave
- 4971 Yuma Ave
- 5106 Via Portola
- 321 Via Metates
- 4951 Yuma Ave
Your Personal Tour Guide
Ask me questions while you tour the home.