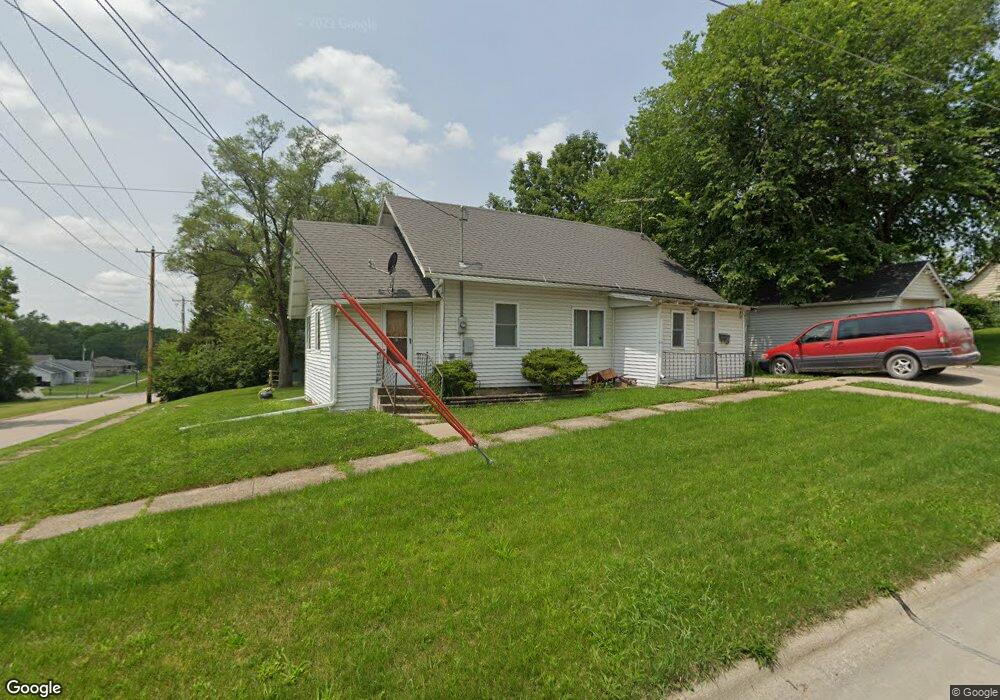
301 W Clay St Osceola, IA 50213
Estimated Value: $80,000 - $108,000
3
Beds
1
Bath
729
Sq Ft
$135/Sq Ft
Est. Value
About This Home
This home is located at 301 W Clay St, Osceola, IA 50213 and is currently estimated at $98,747, approximately $135 per square foot. 301 W Clay St is a home with nearby schools including Clarke Community Elementary School, Clarke Middle School, and Clarke Community High School.
Ownership History
Date
Name
Owned For
Owner Type
Purchase Details
Closed on
Jun 13, 2025
Sold by
David M Thomas Llc
Bought by
Dicristofaro Ana Rodriguez and Diaz Erick Leonardo
Current Estimated Value
Home Financials for this Owner
Home Financials are based on the most recent Mortgage that was taken out on this home.
Original Mortgage
$4,850
Outstanding Balance
$4,793
Interest Rate
6.81%
Mortgage Type
New Conventional
Estimated Equity
$93,954
Purchase Details
Closed on
Jan 12, 2022
Sold by
David M Thomas Llc
Bought by
Rungee Lorrie
Purchase Details
Closed on
May 20, 2009
Sold by
The Esther Thompson Estate
Bought by
David M Thomas Llc
Create a Home Valuation Report for This Property
The Home Valuation Report is an in-depth analysis detailing your home's value as well as a comparison with similar homes in the area
Home Values in the Area
Average Home Value in this Area
Purchase History
| Date | Buyer | Sale Price | Title Company |
|---|---|---|---|
| Dicristofaro Ana Rodriguez | $97,000 | None Listed On Document | |
| Rungee Lorrie | $87,500 | None Listed On Document | |
| David M Thomas Llc | $31,000 | None Available |
Source: Public Records
Mortgage History
| Date | Status | Borrower | Loan Amount |
|---|---|---|---|
| Open | Dicristofaro Ana Rodriguez | $4,850 | |
| Open | Dicristofaro Ana Rodriguez | $95,243 |
Source: Public Records
Tax History Compared to Growth
Tax History
| Year | Tax Paid | Tax Assessment Tax Assessment Total Assessment is a certain percentage of the fair market value that is determined by local assessors to be the total taxable value of land and additions on the property. | Land | Improvement |
|---|---|---|---|---|
| 2024 | $1,302 | $61,850 | $14,600 | $47,250 |
| 2023 | $1,258 | $61,850 | $14,600 | $47,250 |
| 2022 | $1,082 | $47,910 | $15,180 | $32,730 |
| 2021 | $970 | $40,180 | $12,730 | $27,450 |
| 2020 | $944 | $40,180 | $12,730 | $27,450 |
| 2019 | $978 | $40,180 | $0 | $0 |
| 2018 | $954 | $40,250 | $0 | $0 |
| 2017 | $954 | $36,920 | $0 | $0 |
| 2016 | $904 | $36,920 | $0 | $0 |
| 2014 | $872 | $34,420 | $0 | $0 |
Source: Public Records
Map
Nearby Homes
- 321 W Clay St
- 215 W Clay St
- 215 N Lincoln St
- 213 W Logan St
- 101 N Lincoln St
- 601 N Main St
- 214 W Jefferson St
- 117 W Logan St
- 131 N Park St
- 119 N Park St
- 213 N Adams St
- 322 S Temple St
- 220 Eastside Dr
- 420 W Mclane St
- 718 Roosevelt Blvd
- 115 W Mclane St
- 116 W Grant St
- 114 E Grant St
- 321 S Ridge Rd
- 000 Kendall St
- 309 W Clay St
- 217 N Jackson St
- 229 W Clay St
- 300 W Clay St
- 219 W Clay St
- 316 N Jackson St
- 226 W Ayers St
- 222 W Clay St
- 217 W Clay St
- 220 W Clay St
- 212 N Jackson St
- 212 N Jackson St
- 216 W Clay St
- 217 N Temple St
- 220 W Ayers St
- 301 W Ayers St
- 302 N Temple St
- 208 N Jackson St
- 214 W Clay St
- 401 W Clay St