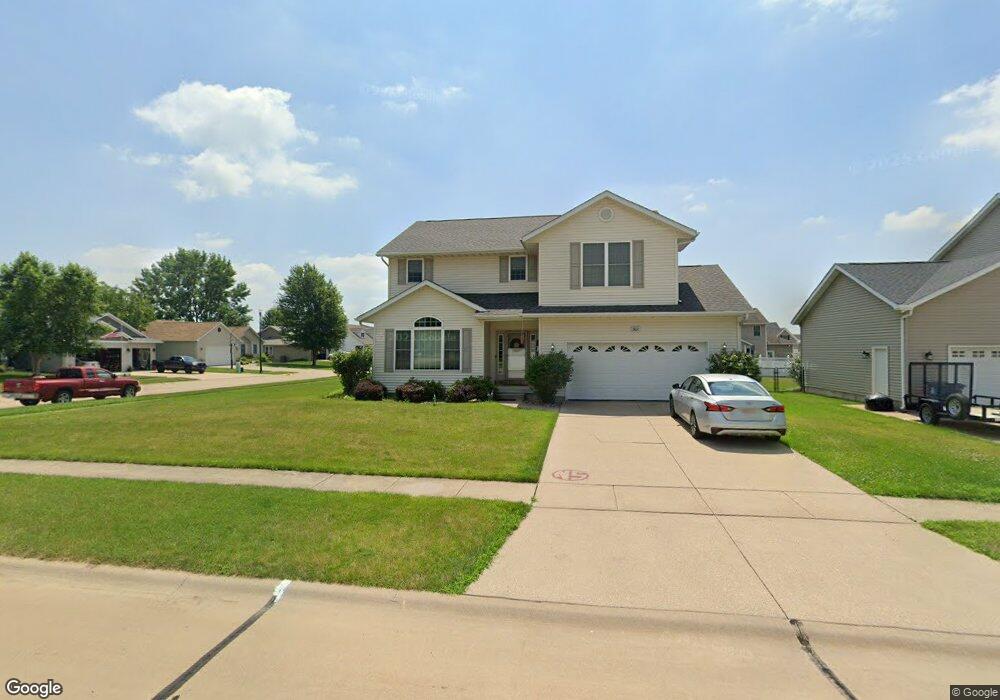
301 W Heather Glen Dr Eldridge, IA 52748
Estimated Value: $451,000 - $493,000
5
Beds
3
Baths
2,241
Sq Ft
$207/Sq Ft
Est. Value
About This Home
This home is located at 301 W Heather Glen Dr, Eldridge, IA 52748 and is currently estimated at $464,309, approximately $207 per square foot. 301 W Heather Glen Dr is a home located in Scott County with nearby schools including Edward White Elementary School, North Scott Junior High School, and North Scott Senior High School.
Ownership History
Date
Name
Owned For
Owner Type
Purchase Details
Closed on
Jun 6, 2013
Sold by
Russo Peggy S
Bought by
Lightle Forest J and Lightle Forest J
Current Estimated Value
Home Financials for this Owner
Home Financials are based on the most recent Mortgage that was taken out on this home.
Original Mortgage
$271,369
Outstanding Balance
$191,428
Interest Rate
3.38%
Mortgage Type
New Conventional
Estimated Equity
$272,881
Purchase Details
Closed on
Nov 10, 2009
Sold by
Russo Stephen R
Bought by
Russo Peggy S
Home Financials for this Owner
Home Financials are based on the most recent Mortgage that was taken out on this home.
Original Mortgage
$225,091
Interest Rate
4.87%
Mortgage Type
FHA
Purchase Details
Closed on
Mar 15, 2005
Sold by
Townsend Farm Developers L C
Bought by
Russo Stephen R and Russo Peggy S
Home Financials for this Owner
Home Financials are based on the most recent Mortgage that was taken out on this home.
Original Mortgage
$215,500
Interest Rate
5.64%
Mortgage Type
New Conventional
Create a Home Valuation Report for This Property
The Home Valuation Report is an in-depth analysis detailing your home's value as well as a comparison with similar homes in the area
Home Values in the Area
Average Home Value in this Area
Purchase History
| Date | Buyer | Sale Price | Title Company |
|---|---|---|---|
| Lightle Forest J | $271,000 | None Available | |
| Russo Peggy S | -- | None Available | |
| Russo Stephen R | $35,000 | None Available |
Source: Public Records
Mortgage History
| Date | Status | Borrower | Loan Amount |
|---|---|---|---|
| Open | Lightle Forest J | $271,369 | |
| Previous Owner | Russo Peggy S | $225,091 | |
| Previous Owner | Russo Stephen R | $215,500 |
Source: Public Records
Tax History Compared to Growth
Tax History
| Year | Tax Paid | Tax Assessment Tax Assessment Total Assessment is a certain percentage of the fair market value that is determined by local assessors to be the total taxable value of land and additions on the property. | Land | Improvement |
|---|---|---|---|---|
| 2025 | $4,752 | $419,400 | $95,700 | $323,700 |
| 2024 | $4,626 | $389,400 | $84,100 | $305,300 |
| 2023 | $4,546 | $389,400 | $84,100 | $305,300 |
| 2022 | $4,406 | $324,870 | $49,470 | $275,400 |
| 2021 | $4,406 | $324,870 | $49,470 | $275,400 |
| 2020 | $4,308 | $311,320 | $49,470 | $261,850 |
| 2019 | $4,380 | $303,080 | $41,230 | $261,850 |
| 2018 | $4,468 | $303,080 | $41,230 | $261,850 |
| 2017 | $1,667 | $303,080 | $41,230 | $261,850 |
| 2016 | $4,120 | $279,050 | $0 | $0 |
| 2015 | $4,120 | $267,160 | $0 | $0 |
| 2014 | $4,004 | $267,160 | $0 | $0 |
| 2013 | $3,930 | $0 | $0 | $0 |
| 2012 | -- | $269,480 | $41,230 | $228,250 |
Source: Public Records
Map
Nearby Homes
- 850 Sawgrass Ct
- 317 W Oak St
- 624 S 4th St
- 1218 S 2nd St
- 1832 Redbud Cir
- 1867 Redbud Cir Unit 102
- 1867 Redbud Cir Unit 103
- 1875 Redbud Cir Unit 101
- 1875 Redbud Cir Unit 103
- 1875 Redbud Cir Unit 102
- 1867 Redbud Cir Unit 101
- Lot 22 S 5th St
- 800 S 8th St
- 513 S 7th St
- 1719 5th St
- 1719 S 5th St
- 509 S 7th St
- 1704 Redbud Cir Unit 102
- 1704 Redbud Cir Unit 103
- 1704 Redbud Cir Unit 101
- 311 W Heather Glen Dr
- 306 W Broadmoor Dr
- 321 W Heather Glen Dr
- 322 W Broadmoor Dr
- 1015 S 3rd St
- 1007 S 3rd St
- 312 Heather Glen
- 1019 S 3rd St
- 302 W Heather Glen Dr
- 338 W Broadmoor Dr
- 312 W Heather Glen Dr
- 931 S 3rd St
- 331 W Heather Glen Dr
- 1025 S 3rd St
- 322 W Heather Glen Dr
- 354 W Broadmoor Dr
- 925 S 3rd St
- 332 W Heather Glen Dr
- 341 W Heather Glen Dr
- 303 W Doral Dr