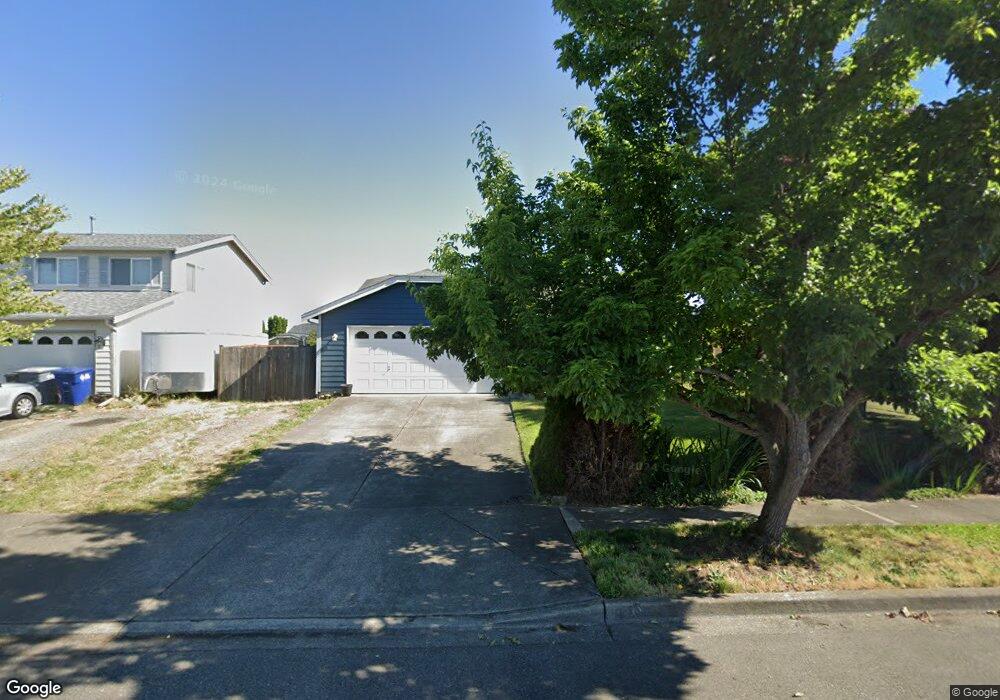
301 Williams Blvd NW Orting, WA 98360
Estimated Value: $452,000 - $497,000
3
Beds
2
Baths
1,404
Sq Ft
$341/Sq Ft
Est. Value
About This Home
This home is located at 301 Williams Blvd NW, Orting, WA 98360 and is currently estimated at $478,793, approximately $341 per square foot. 301 Williams Blvd NW is a home located in Pierce County with nearby schools including Orting Elementary School, Ptarmigan Ridge Elementary School, and Orting Middle School.
Ownership History
Date
Name
Owned For
Owner Type
Purchase Details
Closed on
Mar 6, 2001
Sold by
Daniels Herbert
Bought by
Prong Edward L and Prong Chantel M
Current Estimated Value
Home Financials for this Owner
Home Financials are based on the most recent Mortgage that was taken out on this home.
Original Mortgage
$150,375
Outstanding Balance
$53,097
Interest Rate
7.12%
Mortgage Type
FHA
Estimated Equity
$425,696
Purchase Details
Closed on
Jan 7, 1999
Sold by
Hines Jerry E
Bought by
Daniels Herbert and Daniels Bethany
Home Financials for this Owner
Home Financials are based on the most recent Mortgage that was taken out on this home.
Original Mortgage
$127,500
Interest Rate
6.66%
Mortgage Type
VA
Purchase Details
Closed on
Aug 27, 1997
Sold by
Village Green Ltd Partnership
Bought by
Hines Jerry E and Hines Tommi Sue A
Home Financials for this Owner
Home Financials are based on the most recent Mortgage that was taken out on this home.
Original Mortgage
$115,150
Interest Rate
7.43%
Create a Home Valuation Report for This Property
The Home Valuation Report is an in-depth analysis detailing your home's value as well as a comparison with similar homes in the area
Home Values in the Area
Average Home Value in this Area
Purchase History
We collect this data history from publicly available records. To have your information removed, we recommend requesting removal directly through your county’s website.
| Date | Buyer | Sale Price | Title Company |
|---|---|---|---|
| Prong Edward L | $152,500 | Stewart Title | |
| Daniels Herbert | $125,000 | Transnation Title Insurance | |
| Hines Jerry E | $118,775 | -- |
Source: Public Records
Mortgage History
We collect this data history from publicly available records. To have your information removed, we recommend requesting removal directly through your county’s website.
| Date | Status | Borrower | Loan Amount |
|---|---|---|---|
| Open | Prong Edward L | $150,375 | |
| Previous Owner | Daniels Herbert | $127,500 | |
| Previous Owner | Hines Jerry E | $115,150 |
Source: Public Records
Tax History
| Year | Tax Paid | Tax Assessment Tax Assessment Total Assessment is a certain percentage of the fair market value that is determined by local assessors to be the total taxable value of land and additions on the property. | Land | Improvement |
|---|---|---|---|---|
| 2025 | $3,773 | $439,600 | $203,600 | $236,000 |
| 2024 | $3,773 | $435,100 | $203,600 | $231,500 |
| 2023 | $3,773 | $408,700 | $195,400 | $213,300 |
| 2022 | $3,535 | $425,000 | $195,400 | $229,600 |
| 2021 | $3,632 | $300,000 | $117,200 | $182,800 |
| 2019 | $3,273 | $269,600 | $99,500 | $170,100 |
| 2018 | $3,356 | $254,000 | $86,700 | $167,300 |
| 2017 | $3,077 | $222,600 | $69,600 | $153,000 |
| 2016 | $2,841 | $183,700 | $54,400 | $129,300 |
| 2014 | $2,374 | $169,600 | $48,600 | $121,000 |
| 2013 | $2,374 | $140,400 | $38,200 | $102,200 |
Source: Public Records
Map
Nearby Homes
- 317 Williams Blvd NW
- 1316 Headley Ave NW
- 412 Ozzie St NW
- 1105 Boatman Ave NW
- 207 Williams Blvd NE
- 811 Williams St NW
- 213 Williams Blvd NE
- 15301 147th Ave E
- 1213 Williams Ct NW
- 207 Fielding St NE
- 1306 Hansberry Ave NE
- 214 Fielding St NE
- 206 Lane Blvd NW
- 1605 Riddell Ave NE
- 209 Burr St NE
- 914 O'Farrell Ln NW
- 919 Sigafoos Ave NW
- 1408 Daffodil Ave NE
- 14922 145th Avenue Ct E
- 14703 151st Ave E
- 304 Whitley St NW
- 306 Whitley St NW
- 302 Whitley St NW
- 308 Whitley St NW
- 303 Williams Blvd NW
- 305 Williams Blvd NW
- 307 Williams Blvd NW
- 310 Whitley St NW
- 303 Whitley St NW
- 305 Whitley St NW
- 301 Whitley St NW
- 307 Whitley St NW
- 208 Whitley St NW
- 309 Williams Blvd NW
- 209 Whitley St NW
- 309 Whitley St NW
- 207 Williams Blvd NW
- 312 Whitley St NW
- 311 Williams Blvd NW
- 207 Whitley St NW
Your Personal Tour Guide
Ask me questions while you tour the home.