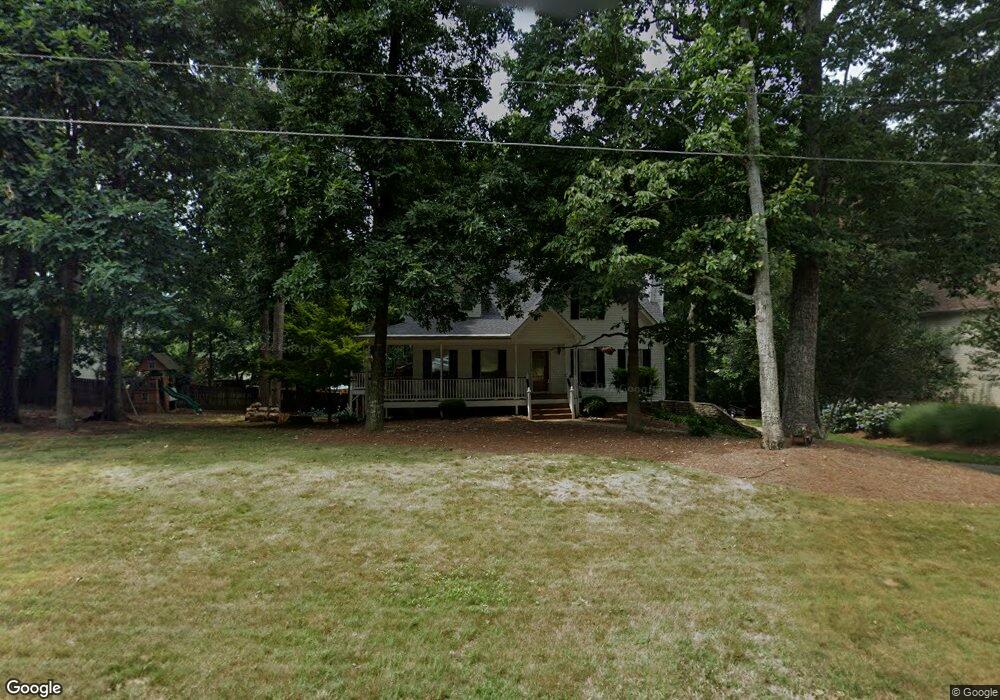
301 Windstone Trace Canton, GA 30114
Estimated Value: $467,712 - $468,000
3
Beds
5
Baths
2,968
Sq Ft
$158/Sq Ft
Est. Value
About This Home
This home is located at 301 Windstone Trace, Canton, GA 30114 and is currently estimated at $467,856, approximately $157 per square foot. 301 Windstone Trace is a home located in Cherokee County with nearby schools including R. M. Moore Elementary School, Teasley Middle School, and Cherokee High School.
Ownership History
Date
Name
Owned For
Owner Type
Purchase Details
Closed on
Sep 18, 2024
Sold by
Weinstiger Denver L
Bought by
Weinstiger Denver L and Weinstiger Connie A
Current Estimated Value
Purchase Details
Closed on
Jul 30, 1999
Sold by
Weinstiger Denver L
Bought by
Weinstiger Mary I
Home Financials for this Owner
Home Financials are based on the most recent Mortgage that was taken out on this home.
Original Mortgage
$113,000
Interest Rate
7.5%
Purchase Details
Closed on
Jul 14, 1999
Sold by
Keatley Michael E and Keatley Cinnamon E
Bought by
Weistiger Mary I and Weistiger Denver L
Home Financials for this Owner
Home Financials are based on the most recent Mortgage that was taken out on this home.
Original Mortgage
$113,000
Interest Rate
7.5%
Purchase Details
Closed on
Mar 25, 1998
Sold by
Harrington Homes
Bought by
Keatley Michael E and Keatley Cinnamon E
Create a Home Valuation Report for This Property
The Home Valuation Report is an in-depth analysis detailing your home's value as well as a comparison with similar homes in the area
Home Values in the Area
Average Home Value in this Area
Purchase History
| Date | Buyer | Sale Price | Title Company |
|---|---|---|---|
| Weinstiger Denver L | -- | -- | |
| Weinstiger Mary I | -- | -- | |
| Weistiger Mary I | $141,500 | -- | |
| Keatley Michael E | $135,000 | -- |
Source: Public Records
Mortgage History
| Date | Status | Borrower | Loan Amount |
|---|---|---|---|
| Previous Owner | Weistiger Mary I | $113,000 |
Source: Public Records
Tax History
| Year | Tax Paid | Tax Assessment Tax Assessment Total Assessment is a certain percentage of the fair market value that is determined by local assessors to be the total taxable value of land and additions on the property. | Land | Improvement |
|---|---|---|---|---|
| 2025 | $893 | $187,404 | $32,000 | $155,404 |
| 2024 | $878 | $190,908 | $30,000 | $160,908 |
| 2023 | $912 | $185,932 | $30,000 | $155,932 |
| 2022 | $735 | $132,724 | $20,000 | $112,724 |
| 2021 | $742 | $117,456 | $20,000 | $97,456 |
| 2020 | $725 | $112,228 | $20,000 | $92,228 |
| 2019 | $712 | $108,840 | $20,000 | $88,840 |
| 2018 | $667 | $93,760 | $18,760 | $75,000 |
| 2017 | $674 | $228,000 | $18,760 | $72,440 |
| 2016 | $650 | $199,800 | $13,600 | $66,320 |
| 2015 | $665 | $195,600 | $13,600 | $64,640 |
| 2014 | $632 | $173,900 | $11,600 | $57,960 |
Source: Public Records
Map
Nearby Homes
- 109 Summer Breeze Ln
- 540 Byrd Mountain Ln
- 569 Byrd Mountain Ln
- 236 Laurel Vista Dr
- 437 Mccurry Trail
- 226 Crescent Moon Way
- 601 Longleaf Way
- 105 Laurel Canyon Trail
- 106 Twilight Overlook
- 239 Crescent Moon Way
- 508 Crested Hawk Ridge
- 265 Fountain Oak Way
- 540 Laurel Canyon Pkwy
- 533 Windy Ridge Ct
- 249 Fountain Oak Way
- 270 Fountain Oak Way
- 170 Greenbrier Way
- 206 Woodridge Terrace
- 322 Tupelo Trail
- 422 Windy Ridge Way
- 128 Timberland Dr
- 124 Timberland Dr
- 132 Timberland Dr
- 304 Windstone Trace
- 309 Windstone Trace
- 200 Red Fern Ct
- 308 Windstone Trace
- 136 Timberland Dr
- 201 Red Fern Ct
- 131 Timberland Dr
- 120 Timberland Dr
- 313 Windstone Trace
- 140 Timberland Dr
- 312 Windstone Trace
- 401 Moss Rose Ln
- 119 Timberland Dr
- 116 Timberland Dr
- 204 Red Fern Ct
- 205 Red Fern Ct
- 405 Moss Rose Ln
Your Personal Tour Guide
Ask me questions while you tour the home.